Buy List YTD
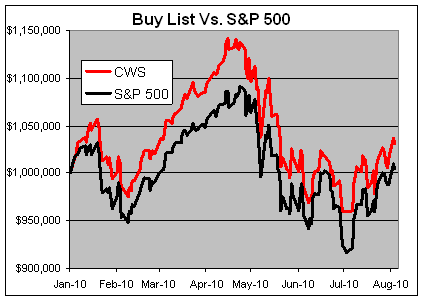
Here’s an update on how the Buy List is doing so far this year. Through today, the average of the 20 stocks is up 3.03% compared with 0.48% for the S&P 500 (neither figure includes dividends). We’re on track for beating the market for the fourth straight year.
The rules of the Buy List are that I chose 20 stocks at the beginning of the year. Once they’re chosen, it’s set. I can’t make any changes during the entire year.
For tracking purposes, I assume the Buy List is a $1 million portfolio, equally weighted with $50,000 in 20 different positions as of the closing price of the previous year. Each year, I only change five of the stocks.
By mid-April, we had a big 6% lead over the market but that’s been cut in half since then. We’re still 2.55% ahead of the market.
Here’s our stock-by-stock record:
| Company | Profit or Loss |
| AFL | 7.70% |
| BAX | -24.30% |
| BDX | -10.65% |
| BBBY | -0.73% |
| EV | -0.07% |
| LLY | 2.44% |
| FISV | 4.50% |
| GILD | -20.31% |
| INTC | 2.30% |
| JNJ | -7.86% |
| JOSB | 36.90% |
| LUK | -4.20% |
| MDT | -14.53% |
| MOG-A | 22.99% |
| NICK | 26.85% |
| RAI | 8.48% |
| SEIC | 11.47% |
| SYK | -5.18% |
| SYY | 12.53% |
| WXS | 12.37% |
If you started the year with, say, $10 billion and followed my advice, I would have made you over $300 million.
And I don’t charge nothing neither!
Posted by Eddy Elfenbein on August 3rd, 2010 at 4:23 pm
The information in this blog post represents my own opinions and does not contain a recommendation for any particular security or investment. I or my affiliates may hold positions or other interests in securities mentioned in the Blog, please see my Disclaimer page for my full disclaimer.
- Load More
Does anyone have a suit of armor, jet skis and a blowtorch I can borrow/rent? There's an experiment I'm working on.
This is pretty amazing. US elections combined since 1924:
GOP: 1,058,301,749
DEM: 1,057,846,951
Oth: 88,548,252Unemployment spikes in Washington, DC
-
-
Archives
- April 2025
- March 2025
- February 2025
- January 2025
- December 2024
- November 2024
- October 2024
- September 2024
- August 2024
- July 2024
- June 2024
- May 2024
- April 2024
- March 2024
- February 2024
- January 2024
- December 2023
- November 2023
- October 2023
- September 2023
- August 2023
- July 2023
- June 2023
- May 2023
- April 2023
- March 2023
- February 2023
- January 2023
- December 2022
- November 2022
- October 2022
- September 2022
- August 2022
- July 2022
- June 2022
- May 2022
- April 2022
- March 2022
- February 2022
- January 2022
- December 2021
- November 2021
- October 2021
- September 2021
- August 2021
- July 2021
- June 2021
- May 2021
- April 2021
- March 2021
- February 2021
- January 2021
- December 2020
- November 2020
- October 2020
- September 2020
- August 2020
- July 2020
- June 2020
- May 2020
- April 2020
- March 2020
- February 2020
- January 2020
- December 2019
- November 2019
- October 2019
- September 2019
- August 2019
- July 2019
- June 2019
- May 2019
- April 2019
- March 2019
- February 2019
- January 2019
- December 2018
- November 2018
- October 2018
- September 2018
- August 2018
- July 2018
- June 2018
- May 2018
- April 2018
- March 2018
- February 2018
- January 2018
- December 2017
- November 2017
- October 2017
- September 2017
- August 2017
- July 2017
- June 2017
- May 2017
- April 2017
- March 2017
- February 2017
- January 2017
- December 2016
- November 2016
- October 2016
- September 2016
- August 2016
- July 2016
- June 2016
- May 2016
- April 2016
- March 2016
- February 2016
- January 2016
- December 2015
- November 2015
- October 2015
- September 2015
- August 2015
- July 2015
- June 2015
- May 2015
- April 2015
- March 2015
- February 2015
- January 2015
- December 2014
- November 2014
- October 2014
- September 2014
- August 2014
- July 2014
- June 2014
- May 2014
- April 2014
- March 2014
- February 2014
- January 2014
- December 2013
- November 2013
- October 2013
- September 2013
- August 2013
- July 2013
- June 2013
- May 2013
- April 2013
- March 2013
- February 2013
- January 2013
- December 2012
- November 2012
- October 2012
- September 2012
- August 2012
- July 2012
- June 2012
- May 2012
- April 2012
- March 2012
- February 2012
- January 2012
- December 2011
- November 2011
- October 2011
- September 2011
- August 2011
- July 2011
- June 2011
- May 2011
- April 2011
- March 2011
- February 2011
- January 2011
- December 2010
- November 2010
- October 2010
- September 2010
- August 2010
- July 2010
- June 2010
- May 2010
- April 2010
- March 2010
- February 2010
- January 2010
- December 2009
- November 2009
- October 2009
- September 2009
- August 2009
- July 2009
- June 2009
- May 2009
- April 2009
- March 2009
- February 2009
- January 2009
- December 2008
- November 2008
- October 2008
- September 2008
- August 2008
- July 2008
- June 2008
- May 2008
- April 2008
- March 2008
- February 2008
- January 2008
- December 2007
- November 2007
- October 2007
- September 2007
- August 2007
- July 2007
- June 2007
- May 2007
- April 2007
- March 2007
- February 2007
- January 2007
- December 2006
- November 2006
- October 2006
- September 2006
- August 2006
- July 2006
- June 2006
- May 2006
- April 2006
- March 2006
- February 2006
- January 2006
- December 2005
- November 2005
- October 2005
- September 2005
- August 2005
- July 2005
 Eddy Elfenbein is a Washington, DC-based speaker, portfolio manager and editor of the blog Crossing Wall Street. His