Archive for 2006
-
Fifty Years Ago Today
Eddy Elfenbein, October 8th, 2006 at 9:59 pm
Twenty-seven batters up. Twenty-seven down.
Retrosheet has the details: -
Today’s Jobs Report
Eddy Elfenbein, October 6th, 2006 at 9:25 amThis morning, the government reported that the unemployment rate fell to 4.6% (or 4.578% to be exact), which is the lowest rate since before 9/11. But the economy only created 51,000 new jobs last month which is less than half what economists were expecting.
The economic environment continues to be defined as one with surging corporate profits and very meager job growth. Over the last three years, the economy has created an average of 160,000 new jobs a month, which is just barely above the rate of growth of the labor pool. Contrast this with the 1990s when the economy routinely created over 250,000 jobs a month. -
Berkshire Hathaway Breaks $100,000
Eddy Elfenbein, October 5th, 2006 at 4:04 pm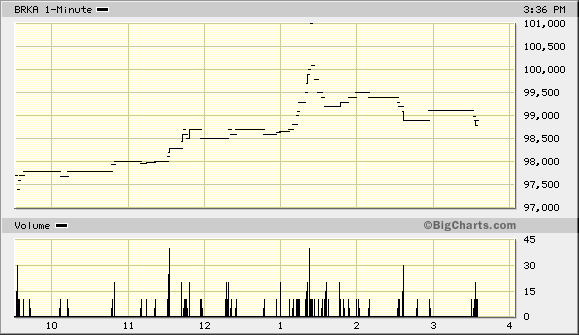
The stock reached $100 a share on the first day of trading in 1977. -
The Correlation of Stocks and Bonds
Eddy Elfenbein, October 5th, 2006 at 12:58 pmI wanted to follow-up on my previous post about how stocks and bonds have become correlated.
This is a very important point, and I think it explains much of the recent rally. Here’s at look at how they’ve performed since April 25. For my bond proxy, I’m using the American Century Target Maturity 2025 Fund (BTTRX).
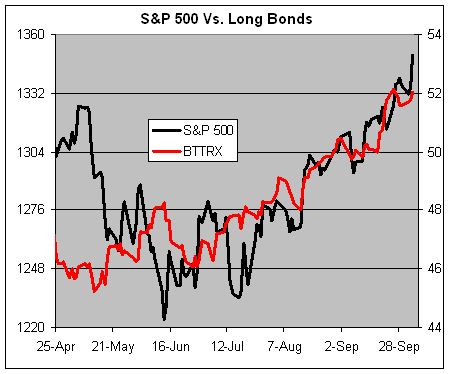
The two asset categories were negatively correlated until the middle of June. Since then, stocks and bonds have moved in tandem.
A scatter plot will show it better. Here’s the S&P 500 and the BTTRX from April 25 to June 15:
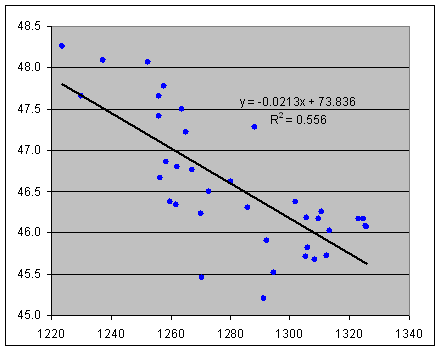
A downward sloping lines mean a negative correlation. The worse bonds did, the better stocks did. This tells us that money went directly out of one asset and into the other. But then, the markets suddenly converged in mid-June. Here’s a scatterplot from June 16 to yesterday:
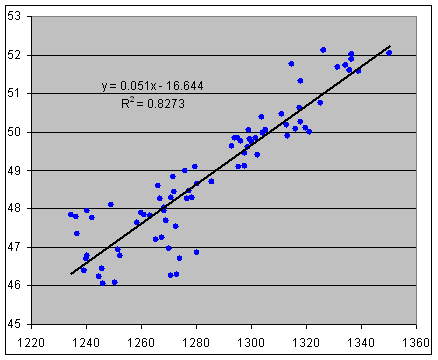
Except for a few strays, that’s a pretty strong positive correlation. This tells us that money was coming out of hard assets like gold and into paper assets. -
Third-Quarter Earnings Season
Eddy Elfenbein, October 5th, 2006 at 11:21 amThirteen of our 20 Buy List stocks ended their quarter in September, so we have these earnings announcements to look forward to:
Company…………………..Ticker…………………Date……………………EPS
Wachovia…………………….WB……………………16-Oct…………………$1.19
SEI Investments…………..SEIC …………………18-Oct…………………$0.57
Danaher………………………DHR …………………19-Oct…………………$0.82
UnitedHealth Group………UNH…………………..19-Oct………………..$0.76
Brown & Brown…………….BRO…………………..23-Oct………………..$0.28
AFLAC………………………….AFL……………………24-Oct………………..$0.72
Fiserv…………………………..FISV………………….24-Oct………………..$0.62
Varian Medical Systems….VAR……………………25-Oct………………..$0.53
Expeditors International…EXPD…………………7-Nov…………………$0.30
Fair Isaac……………………..FIC………………………TBA………………….$0.57
Harley-Davidson…………….HOG…………………….TBA………………….$1.10
Respironics……………………RESP……………………TBA………………….$0.30
Sysco……………………………SYY……………………..TBA………………….$0.36 -
The Campari Family Feud
Eddy Elfenbein, October 5th, 2006 at 6:43 amHow’s this for a dysfunctional family:
Luca Garavoglia, chairman of the Milan-based beverage company, has just been slapped with a court order to pay his sister and fellow shareholder 100 million euros ($127 million) in damages.
Maddalena Garavoglia had complained in court in 2000 that the company, in which she held a 23% stake, had tried to push her out in the run up to its 2001 stock-market listing. Using a capital increase, she alleged, it tried to pressured her to sell her holdings to investment powerhouse UBS, misleading her about the value of her stake.That’s not all. Maddalena’s brother and mother also face criminal charges for allegedly giving her false information.
-
Value Versus Growth
Eddy Elfenbein, October 4th, 2006 at 3:45 pmThe market is rolling again today. The Dow broke 11850 and the S&P 500 is closing in on 1350. I’ve mentioned before that this is one of few market rallies I can think of where the market’s P/E ratio has declined as the rally has wore on. Not only that, the market”s dividend yield has climbed as well. In other words, as well as stocks are doing, profits and dividends are growing faster.
There’s something else interesting to note which is probably related. Value stocks have led growth stocks during this rally. Looking at the relative performance of growth versus value is a basic sentiment indicator. Growth tends to cream value during market tops, and vice versa during market bottoms.
This rally may not be over. Here’s how growth and value have done since March 2003:
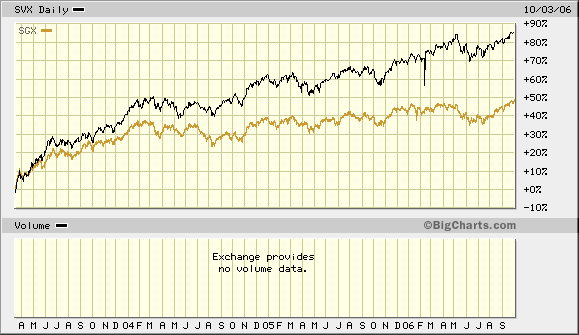
Growth has closed the gap some over the last two months. -
Melissa Francis: Child Star
Eddy Elfenbein, October 4th, 2006 at 2:00 pm
Before she was Melissa Francis, hardass CNBC reporter, she was widdle Missy Francis playing Cassandra Cooper-Ingalls on Little House on the Prairie.
Unlike most child stars, Missy’s future lay not in porn and blow, but Harvard and basic cable. Not that there’s some similarity. -
Wolverine World Wide’s Earnings
Eddy Elfenbein, October 4th, 2006 at 9:28 amWolverine World Wide (WWW) is one of those teeny companies I love to follow. Despite its strange name, the stock is up around 200-fold in the last 30-odd years. Still, most people have never heard of it.
The company makes shoes under various labels like Hush Puppies, Sebago and even Harley-Davidson (HOG), and its stock has been doing very well lately. Shares of WWW are up about 30% for the year.
Today looks to be another good day for Wolverine as the company announced very good earnings this morning. EPS rose 9.5% to 46 cents a share, two cents more than Wall Street was expecting.
This is the company’s 17th straight record quarter. Wolverine also raised its forecast for this year to $1.41 to $1.44 a share, and for next year to $1.56 to $1.62 a share.
Here are the results for the last few years:
Year…………………………..Sales…………………………..EPS
1996………………………..$511.03 ……………………….$0.51
1997………………………..$665.13………………………..$0.64
1998………………………..$669.33………………………..$0.65
1999………………………..$701.29………………………..$0.17
2000………………………..$665.58………………………..$0.52
2001………………………..$720.07………………………..$0.72
2002………………………..$827.11………………………..$0.77
2003………………………..$888.93………………………..$0.85
2004……………………..$1,061.00………………………..$1.27
2005………………………..$991.91………………………..$1.09
2006*………………………$800.15………………………..$1.05
* First Nine Month -
Erasing Our Losses
Eddy Elfenbein, October 4th, 2006 at 12:27 amThe New York Times writes:
Market historians have noted that stocks can take a long time to recover from periods of great excess. The Dow and the S.&. P., for instance, did not return to their 1929 pre-crash peaks until 1954, long after the Depression and World War II ended.
That’s true, but it ignores the effect of dividends–which were quite generous back then–and inflation, which in this case was deflation.
The total return of the stock market in real terms made a new high by 1936, which is surprisingly similar to the period from the March 2000 peak to today. After 1936, the market collapsed again for another five years.
- Tweets by @EddyElfenbein
-
-
Archives
- October 2024
- September 2024
- August 2024
- July 2024
- June 2024
- May 2024
- April 2024
- March 2024
- February 2024
- January 2024
- December 2023
- November 2023
- October 2023
- September 2023
- August 2023
- July 2023
- June 2023
- May 2023
- April 2023
- March 2023
- February 2023
- January 2023
- December 2022
- November 2022
- October 2022
- September 2022
- August 2022
- July 2022
- June 2022
- May 2022
- April 2022
- March 2022
- February 2022
- January 2022
- December 2021
- November 2021
- October 2021
- September 2021
- August 2021
- July 2021
- June 2021
- May 2021
- April 2021
- March 2021
- February 2021
- January 2021
- December 2020
- November 2020
- October 2020
- September 2020
- August 2020
- July 2020
- June 2020
- May 2020
- April 2020
- March 2020
- February 2020
- January 2020
- December 2019
- November 2019
- October 2019
- September 2019
- August 2019
- July 2019
- June 2019
- May 2019
- April 2019
- March 2019
- February 2019
- January 2019
- December 2018
- November 2018
- October 2018
- September 2018
- August 2018
- July 2018
- June 2018
- May 2018
- April 2018
- March 2018
- February 2018
- January 2018
- December 2017
- November 2017
- October 2017
- September 2017
- August 2017
- July 2017
- June 2017
- May 2017
- April 2017
- March 2017
- February 2017
- January 2017
- December 2016
- November 2016
- October 2016
- September 2016
- August 2016
- July 2016
- June 2016
- May 2016
- April 2016
- March 2016
- February 2016
- January 2016
- December 2015
- November 2015
- October 2015
- September 2015
- August 2015
- July 2015
- June 2015
- May 2015
- April 2015
- March 2015
- February 2015
- January 2015
- December 2014
- November 2014
- October 2014
- September 2014
- August 2014
- July 2014
- June 2014
- May 2014
- April 2014
- March 2014
- February 2014
- January 2014
- December 2013
- November 2013
- October 2013
- September 2013
- August 2013
- July 2013
- June 2013
- May 2013
- April 2013
- March 2013
- February 2013
- January 2013
- December 2012
- November 2012
- October 2012
- September 2012
- August 2012
- July 2012
- June 2012
- May 2012
- April 2012
- March 2012
- February 2012
- January 2012
- December 2011
- November 2011
- October 2011
- September 2011
- August 2011
- July 2011
- June 2011
- May 2011
- April 2011
- March 2011
- February 2011
- January 2011
- December 2010
- November 2010
- October 2010
- September 2010
- August 2010
- July 2010
- June 2010
- May 2010
- April 2010
- March 2010
- February 2010
- January 2010
- December 2009
- November 2009
- October 2009
- September 2009
- August 2009
- July 2009
- June 2009
- May 2009
- April 2009
- March 2009
- February 2009
- January 2009
- December 2008
- November 2008
- October 2008
- September 2008
- August 2008
- July 2008
- June 2008
- May 2008
- April 2008
- March 2008
- February 2008
- January 2008
- December 2007
- November 2007
- October 2007
- September 2007
- August 2007
- July 2007
- June 2007
- May 2007
- April 2007
- March 2007
- February 2007
- January 2007
- December 2006
- November 2006
- October 2006
- September 2006
- August 2006
- July 2006
- June 2006
- May 2006
- April 2006
- March 2006
- February 2006
- January 2006
- December 2005
- November 2005
- October 2005
- September 2005
- August 2005
- July 2005
 Eddy Elfenbein is a Washington, DC-based speaker, portfolio manager and editor of the blog Crossing Wall Street. His