Archive for 2007
-
The Decline of Fannie
Eddy Elfenbein, November 16th, 2007 at 11:18 amI have to say that I’m amazed by the decline and fall of Fannie Mae (FNM). Not that the company doesn’t deserve it, but to anyone who know who remembers the esteem with which this stock was held, the recent fall has to be disheartening. In the last six weeks, the shares are down -41%.
Shares of Fannie Mae were a no brainer for years. From late 1981 to late 2001, the stock went from 50 cents a share (adjusted for a 12-for-1 split) to $80 a share. Throw in dividends and that’s about another 100% to your return. That’s a return to investors of over 30% a year for two decades!
Today the stock broke below $38 a share, a level it first hit 11 years ago. Fannie Mae was loved by everyone. Peter Lynch touted it in his books. It was politically popular. Who could be against homeownership? Unlike the tobacco stocks, which everyone hated.
Here’s perhaps the most amazing stat: Both Fannie Mae and Altria (MO) are projected to earn $4.68 a share next year. Yet, Altria is going for $73 a share, which is close to twice FNM’s price. -
Inflation and Sex
Eddy Elfenbein, November 16th, 2007 at 10:46 amWhen people are asked what the inflation rate is, apparently your gender is an important factor. Caroline Baum has the 411:
“That men and women occasionally see things differently is not a remarkable observation,” says Michael Bryan, economist at the Federal Reserve Bank of Cleveland. “But that the sexes could report vastly different perspectives on the rate at which prices are rising over a long period of time is astonishing.”
Bryan has studied decades of data on this battle of the sexes, using the University of Michigan Survey of Consumers, a joint survey conducted by the Cleveland Fed and Ohio State University among others. He found that demographics played a role in determining the public’s estimates and predictions of inflation.
Those who are rich, married, white and middle-aged have lower inflation perceptions and expectations than those who are poor, single, non-white and young. That seems almost intuitive: Society’s “haves” are better positioned to endure cost-of- living increases than the “have-nots.”
New View
Yet even after holding income, age, education, race and marital status constant, “men and women hold very different views on the rate at which prices are changing.” Bryan writes in a November 2001 commentary, “The Curiously Different Inflation Perspectives of Men and Women.” Women consistently think inflation is 1.9 percentage points higher than men, and they expect prices to rise 2.1 percentage points more than men.Baum recommends that Bernanke should go to Tupperware parties. But how does she know he doesn’t?
-
Nassim Nicholas Taleb on Charlie Rose
Eddy Elfenbein, November 16th, 2007 at 8:31 am -
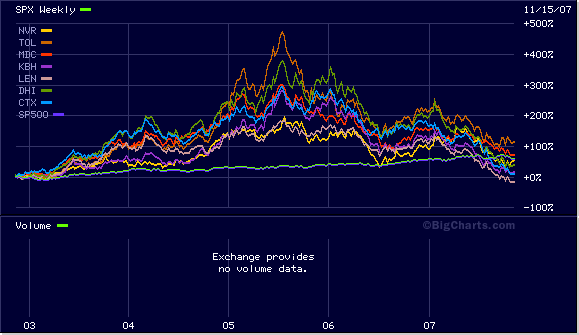
Homebuilding Stocks
Eddy Elfenbein, November 16th, 2007 at 7:53 amHere’s a colorful look at how some homebuilders have done for the past five years. As you can see, a company’s industry group is a major indicator of returns:
-
Sign of the Times
Eddy Elfenbein, November 15th, 2007 at 6:32 pmThe dollar’s prestige continues to suffer:
In a video for the movie “American Gangster,” hip-hop maestro Jay-Z thumbs through a wad of 500-euro notes on a night of cruising through the concrete canyons of New York, a city where the euro isn’t legal tender.
-
The Cyclical Bear Market
Eddy Elfenbein, November 15th, 2007 at 4:31 pmOver the summer, I had several posts about how the outperformance of cyclical stocks was soon going to end. I particularly looked at how the Morgan Stanley Cyclical Index (^CYC) was doing relative to the S&P 500 (^SPX)
Here’s part of a column I wrote for Real Money five months ago.The boilermaker index has been on fire recently. The CYC is up over 22% this year and up over 40% in the past 11 months. Going back to the March 2003 low, the CYC has jumped 180%, which doubles the S&P 500. Not too shabby.
But the best has come recently.
This year, the CYC has already set an amazing 40 new highs. In April it burst through 1000, and it’s quickly closing in on 1100. Like all good rallies, however, this must come to an end, and I’m afraid it won’t be pretty.
The important thing to remember is that cyclical stocks are…well, cyclical. They move up, and they move down. Personally, I like the “up” part the best. Historically, each cycle has lasted around five to seven years, so the clock is running out on this latest cycle, which began in September 2000 just as the tech sector was returning from its romp through Bubblestan.
Another important fact to remember is that cyclicals have a nice habit of outperforming the stock market when the market itself is doing well but underperforming when stocks take a beating.The end finally came on July 19. Since then, the CYC is down -13.4% while the S&P 500 is down just -6.6%.

I think the underperformance will continue for a few years. -
My Favorite Links
Eddy Elfenbein, November 15th, 2007 at 2:39 pmI don’t do this often enough, but please visit my links page to read some of my favorite stock bloggers. Here are some blogs I’ve been reading lately:
- 10Q Detective
- Abnormal Returns
- Bespoke Investment Group
- The Big Picture
- Mebane Faber
- Footnoted.org
- Infectious Greed
- Jeff Matthews
- Jeff Miller
- The Kirk Report
- Marginal Revolution
- David Merkel
- The Mess That Greenspan Made
- Random Roger’s Big Picture
- Felix Salmon
- The Stalwart
- Wall Street Folly
-
Modest Inflation Last Month
Eddy Elfenbein, November 15th, 2007 at 11:55 amThe Wall Street Journal reports:
The consumer price index rose 0.3% in October, the Labor Department said Thursday, matching September’s increase. The core CPI, which excludes volatile food and energy prices, advanced 0.2% for a fifth-straight month. The headline and core gains matched Wall Street expectations, according to a Dow Jones Newswires survey.
Unrounded, the CPI rose 0.293% last month. The core CPI advanced 0.159% unrounded.
Consumer prices were up 3.5% from a year ago. The core CPI was up 2.2% compared to the same month a year ago, up from 2.1% in September.
Still, that remains near the 2% top end of the Federal Reserve’s assumed comfort zone for annual core inflation. The Fed’s preferred gauge, the core price index for personal consumption expenditures, is within that range at 1.8% annual growth through September.The government’s inflation data comes in for a lot of well-deserved ribbing. Still, the overall trend of inflation is tame. The United States is in no danger of slipping into hyper-inflation.
Even after high inflation was defeated in the early 1980s, the core CPI rate was often over 5% and that didn’t impede growth. The year-over-year core rate hasn’t gone over 3% or under 1% in over a decade. -
The Yield Curve Widens
Eddy Elfenbein, November 14th, 2007 at 12:28 pm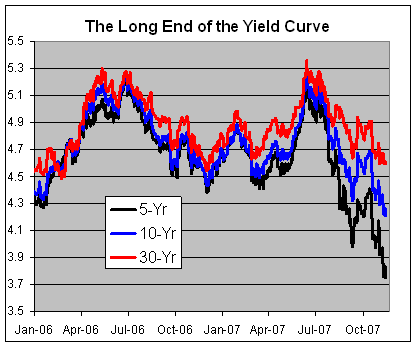
Eighteen months ago, the long end of the yield curve was almost perfectly flat. Today, some daylight can finally be seen between the long-end yields. Even though the 30-year yield isn’t to new lows, the five-year yield certainly is. -
Attention Math Nerds
Eddy Elfenbein, November 13th, 2007 at 1:58 pmHere’s a spreadsheet of some multiple regressions I ran.
I looked at the daily changes of the 10 S&P industry groups against each other. The regressions are the columns not the rows. (I’m afraid I’m out of my depth mathematically, so if anything looks off, please let me know.)
Healthcare and Staples seem to be strongly related. I like to think of them as subsets of one large group called Defensives. Also, Energy and Materials are strongly related. I was surprised to see such a strong connection between Financials and Consumer Discretionary stocks.
- Tweets by @EddyElfenbein
-
-
Archives
- September 2024
- August 2024
- July 2024
- June 2024
- May 2024
- April 2024
- March 2024
- February 2024
- January 2024
- December 2023
- November 2023
- October 2023
- September 2023
- August 2023
- July 2023
- June 2023
- May 2023
- April 2023
- March 2023
- February 2023
- January 2023
- December 2022
- November 2022
- October 2022
- September 2022
- August 2022
- July 2022
- June 2022
- May 2022
- April 2022
- March 2022
- February 2022
- January 2022
- December 2021
- November 2021
- October 2021
- September 2021
- August 2021
- July 2021
- June 2021
- May 2021
- April 2021
- March 2021
- February 2021
- January 2021
- December 2020
- November 2020
- October 2020
- September 2020
- August 2020
- July 2020
- June 2020
- May 2020
- April 2020
- March 2020
- February 2020
- January 2020
- December 2019
- November 2019
- October 2019
- September 2019
- August 2019
- July 2019
- June 2019
- May 2019
- April 2019
- March 2019
- February 2019
- January 2019
- December 2018
- November 2018
- October 2018
- September 2018
- August 2018
- July 2018
- June 2018
- May 2018
- April 2018
- March 2018
- February 2018
- January 2018
- December 2017
- November 2017
- October 2017
- September 2017
- August 2017
- July 2017
- June 2017
- May 2017
- April 2017
- March 2017
- February 2017
- January 2017
- December 2016
- November 2016
- October 2016
- September 2016
- August 2016
- July 2016
- June 2016
- May 2016
- April 2016
- March 2016
- February 2016
- January 2016
- December 2015
- November 2015
- October 2015
- September 2015
- August 2015
- July 2015
- June 2015
- May 2015
- April 2015
- March 2015
- February 2015
- January 2015
- December 2014
- November 2014
- October 2014
- September 2014
- August 2014
- July 2014
- June 2014
- May 2014
- April 2014
- March 2014
- February 2014
- January 2014
- December 2013
- November 2013
- October 2013
- September 2013
- August 2013
- July 2013
- June 2013
- May 2013
- April 2013
- March 2013
- February 2013
- January 2013
- December 2012
- November 2012
- October 2012
- September 2012
- August 2012
- July 2012
- June 2012
- May 2012
- April 2012
- March 2012
- February 2012
- January 2012
- December 2011
- November 2011
- October 2011
- September 2011
- August 2011
- July 2011
- June 2011
- May 2011
- April 2011
- March 2011
- February 2011
- January 2011
- December 2010
- November 2010
- October 2010
- September 2010
- August 2010
- July 2010
- June 2010
- May 2010
- April 2010
- March 2010
- February 2010
- January 2010
- December 2009
- November 2009
- October 2009
- September 2009
- August 2009
- July 2009
- June 2009
- May 2009
- April 2009
- March 2009
- February 2009
- January 2009
- December 2008
- November 2008
- October 2008
- September 2008
- August 2008
- July 2008
- June 2008
- May 2008
- April 2008
- March 2008
- February 2008
- January 2008
- December 2007
- November 2007
- October 2007
- September 2007
- August 2007
- July 2007
- June 2007
- May 2007
- April 2007
- March 2007
- February 2007
- January 2007
- December 2006
- November 2006
- October 2006
- September 2006
- August 2006
- July 2006
- June 2006
- May 2006
- April 2006
- March 2006
- February 2006
- January 2006
- December 2005
- November 2005
- October 2005
- September 2005
- August 2005
- July 2005
 Eddy Elfenbein is a Washington, DC-based speaker, portfolio manager and editor of the blog Crossing Wall Street. His