Archive for January, 2008
-
Cayne Out at Bear
Eddy Elfenbein, January 8th, 2008 at 7:22 amHe’s going. Finally.
Cayne has been CEO since 1993. Except for the past year, shareholders don’t have much to complain about.
-
Bill Gates’ Last Day
Eddy Elfenbein, January 7th, 2008 at 4:59 pm -
Boo-Yah
Eddy Elfenbein, January 7th, 2008 at 4:10 pmCrossing Wall Street: February 25, 2007
I think the markets may be underestimating Senator Obama’s chances. I have no special insight here; it just seems that way. I should add that my judgment in these matters is pretty bad.
Maybe not so bad. At the time, Intrade had “Obama to Win” at just 23 cents. Today, it’s at 66 cents.
-
Volatility’s Impact on the Stock Market
Eddy Elfenbein, January 7th, 2008 at 2:43 pmThe New York Times ran this graph on the stock market’s volatility yesterday. I heard Dylan Ratigan the other day describing how volatile the market is. Actually, the market’s volatility isn’t very high on an historical basis. It’s just much higher than it’s been.
Here’s a look at how well the S&P 500 has done by VIX level, which is an index of implied volatility. I took all the daily returns of the S&P 500 since 1990, and reordered them, not by date, but by VIX level. The Y-axis is the cumulative gain.
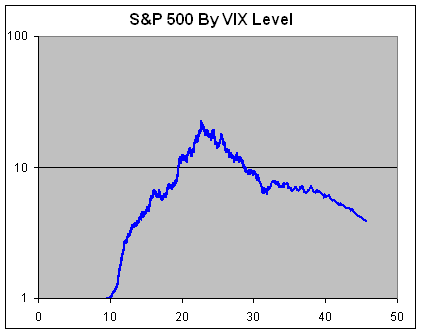
The magic point is 22.66. When the VIX is below that, the market does well. Above that, not so much. Before last July, the stock market had gone over years with only breaking the magic mark twice. Since then, we’ve been above it about half the time.
This comes as a bit of a surprise to me because I’ve generally felt that volatility doesn’t have much impact by itself. Perhaps I have to reconsider, though my chart only includes data since 1990. I wouldn’t mind seeing more.
(Note: Since I wanted to include the VIX numbers on the X-axis, the graph is actually a scatter-plot, so it’s a bit distorted. Here’s a view sans X-axis labels.) -
Could Oil Double From Here
Eddy Elfenbein, January 7th, 2008 at 10:10 amI wouldn’t bet on it, but some folks are:
The fastest-growing bet in the oil market these days is that the price of crude will double to $200 a barrel by the end of the year.
Options to buy oil for $200 on the New York Mercantile Exchange rose 10-fold in the past two months to 5,533 contracts, a record increase for any similar period. The contracts, the cheapest way to speculate in energy markets, appreciated 36 percent since early December as crude futures reached a record $100.09 on Jan. 3.
While analysts at Merrill Lynch & Co. and UBS AG say the slowing U.S. economy will lead to the biggest drop in prices since 2001, the options show some traders expect oil to rise for a seventh straight year. Demand will increase 2.5 percent in 2008, according to the International Energy Agency. U.S. inventories fell to a three-year low on Dec. 28. Production from Mexico is declining and Saudi Arabia is behind schedule in opening its newest field.
“One hundred dollars a barrel is actually 14.9 cents a cup, so we’re still talking about oil being remarkably cheap,” said Matthew R. Simmons, chairman of Simmons & Co. International, a Houston-based investment bank that focuses on energy. Inventories “are tight as a drum and I don’t see how we get out of this box,” he said in a Bloomberg television interview last week. “Demand clearly isn’t starting to slow down.” -
Amazon.com on Wall Strip
Eddy Elfenbein, January 7th, 2008 at 9:48 am -
Which Is A Better Investment?
Eddy Elfenbein, January 7th, 2008 at 9:32 amFord’s stock or your mattress? Check the results:
-
Follow Up on Momentum Stocks
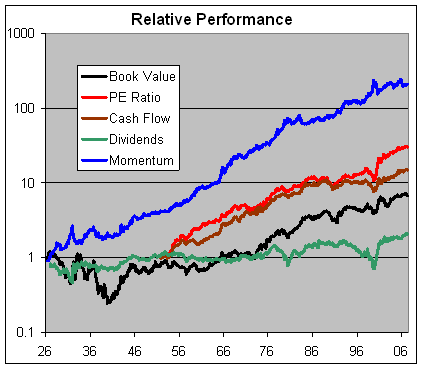
Eddy Elfenbein, January 4th, 2008 at 7:26 pmA few weeks ago, I wrote about the tremendous success of momentum stocks. I wanted to follow up and show you how much better a momentum strategy has done against value-based strategies.
The following chart shows you how the top 10% of momentum stocks have done against the top 10% of book value, P/E ratio, dividend yield and price-to-cash flow. It ain’t close.
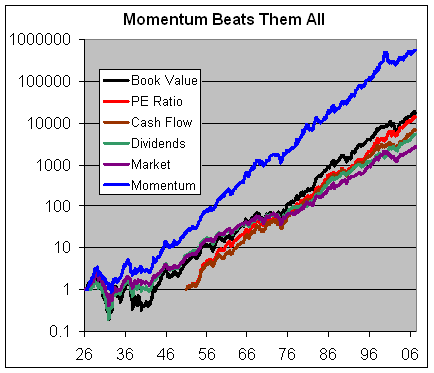
The purple line is the overall market. I got the data from Ken French’s data library. The major glitch is that the cash flow and P/E ratio series begin about 25 years after the others.
I was surprised to see how well the P/E ratio decile (red line) does. It’s the only strategy that puts up a fight against momentum. Since 1974, the P/E ratio decile has slightly beaten the momentum decile.
To give you a clearer picture, here’s the relative performance of the different strategies:
-
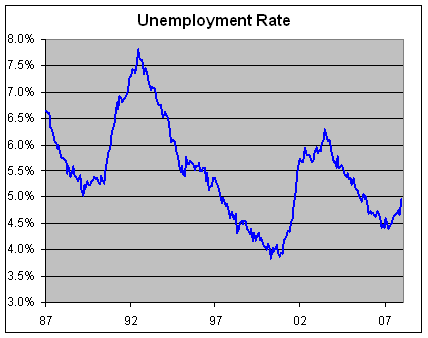
Today’s Jobs Report
Eddy Elfenbein, January 4th, 2008 at 2:30 pmEmployment was lousy last month. The unemployment rate is now 0.57% above its March low. Traditionally, that number doesn’t U-turn after that big a move. After an increase of 0.5%, the trend is usually here to stay, and it doesn’t stop until it increases by more than 2%.
-
A Word on Political Predictions Markets
Eddy Elfenbein, January 4th, 2008 at 11:18 amIt’s strange to see the political predictions markets like Intrade get so much attention recently (see here and here) because, until now, one of the very few people who gave them much attention was…me. As I’ve said before, I don’t place a great deal of faith in these markets, but I think they’re for fun and should be seen that way. (By the way, the top chroniclers of this scene is Chris Masse.)
Let me add a few random thoughts on these markets. The first is that they’re often called “predictions markets,” in fact, I just did, but that’s not quite correct. More accurately, they’re odds setting markets. I’ll hear people say, “Intrade said this will happen, and it didn’t, so Intrade doesn’t work” No, Intrade laid certain odds on an event happening. That doesn’t prevent a longshot from pulling through.
I also hear people say that it just follows the polls. For the most part, that’s true. But not always, and that’s where Intrade can be especially useful. For example, Mike Huckabee’s poll numbers are far better than odds would suggest. Why is that? I’m sure not. Perhaps the market isn’t correct and the Huckabee contract is a good value. Or maybe the market doesn’t see his popularity as lasting very long.
Three years ago, my Nationals got off to a blazing start in the NL East, 50-31 and a 5.5 game lead. They’re odds of winning the division, however, were still very low. The market thought that they would fade, and that’s exactly what happened.
Matthew Yglesias recently made an interesting observation, the markets are pretty boring. He’s right. Day-to-day, it is fairly dull. One thing to remember, though, is that these aren’t stocks, they’re futures. Futures are a strange animal. With futures prices, the underlying volatility can be extremely high, even though the prices can be somewhat stable.
The reason is the dispersion of returns. In others words, a political contract can potentially soar or crumble a great deal in a very short amount of time. I don’t mean just before expiration, I mean at any time. This is also why futures traders are all crazy people. If some candidate had a bad night last night, they’re futures could have fallen dramatically and the market takes that into account.
The price of the futures is the sum total of the odds of very wide-ranging possibilities. Let’s say the McCain contract is at 24 cents. That could be the sum of, say, a 30% chance of going to zero in a week and a 10% chance of going to 90 cents in a week, and many, many others. Unlike stocks, futures are a zero-sum game. If you take from one, you give to another. What would make the futures markets much more exciting would be an options market on the futures, but that would be seriously nerdy. And no one wants that.
- Load More
Does anyone have a suit of armor, jet skis and a blowtorch I can borrow/rent? There's an experiment I'm working on.
This is pretty amazing. US elections combined since 1924:
GOP: 1,058,301,749
DEM: 1,057,846,951
Oth: 88,548,252Unemployment spikes in Washington, DC
-
-
Archives
- April 2025
- March 2025
- February 2025
- January 2025
- December 2024
- November 2024
- October 2024
- September 2024
- August 2024
- July 2024
- June 2024
- May 2024
- April 2024
- March 2024
- February 2024
- January 2024
- December 2023
- November 2023
- October 2023
- September 2023
- August 2023
- July 2023
- June 2023
- May 2023
- April 2023
- March 2023
- February 2023
- January 2023
- December 2022
- November 2022
- October 2022
- September 2022
- August 2022
- July 2022
- June 2022
- May 2022
- April 2022
- March 2022
- February 2022
- January 2022
- December 2021
- November 2021
- October 2021
- September 2021
- August 2021
- July 2021
- June 2021
- May 2021
- April 2021
- March 2021
- February 2021
- January 2021
- December 2020
- November 2020
- October 2020
- September 2020
- August 2020
- July 2020
- June 2020
- May 2020
- April 2020
- March 2020
- February 2020
- January 2020
- December 2019
- November 2019
- October 2019
- September 2019
- August 2019
- July 2019
- June 2019
- May 2019
- April 2019
- March 2019
- February 2019
- January 2019
- December 2018
- November 2018
- October 2018
- September 2018
- August 2018
- July 2018
- June 2018
- May 2018
- April 2018
- March 2018
- February 2018
- January 2018
- December 2017
- November 2017
- October 2017
- September 2017
- August 2017
- July 2017
- June 2017
- May 2017
- April 2017
- March 2017
- February 2017
- January 2017
- December 2016
- November 2016
- October 2016
- September 2016
- August 2016
- July 2016
- June 2016
- May 2016
- April 2016
- March 2016
- February 2016
- January 2016
- December 2015
- November 2015
- October 2015
- September 2015
- August 2015
- July 2015
- June 2015
- May 2015
- April 2015
- March 2015
- February 2015
- January 2015
- December 2014
- November 2014
- October 2014
- September 2014
- August 2014
- July 2014
- June 2014
- May 2014
- April 2014
- March 2014
- February 2014
- January 2014
- December 2013
- November 2013
- October 2013
- September 2013
- August 2013
- July 2013
- June 2013
- May 2013
- April 2013
- March 2013
- February 2013
- January 2013
- December 2012
- November 2012
- October 2012
- September 2012
- August 2012
- July 2012
- June 2012
- May 2012
- April 2012
- March 2012
- February 2012
- January 2012
- December 2011
- November 2011
- October 2011
- September 2011
- August 2011
- July 2011
- June 2011
- May 2011
- April 2011
- March 2011
- February 2011
- January 2011
- December 2010
- November 2010
- October 2010
- September 2010
- August 2010
- July 2010
- June 2010
- May 2010
- April 2010
- March 2010
- February 2010
- January 2010
- December 2009
- November 2009
- October 2009
- September 2009
- August 2009
- July 2009
- June 2009
- May 2009
- April 2009
- March 2009
- February 2009
- January 2009
- December 2008
- November 2008
- October 2008
- September 2008
- August 2008
- July 2008
- June 2008
- May 2008
- April 2008
- March 2008
- February 2008
- January 2008
- December 2007
- November 2007
- October 2007
- September 2007
- August 2007
- July 2007
- June 2007
- May 2007
- April 2007
- March 2007
- February 2007
- January 2007
- December 2006
- November 2006
- October 2006
- September 2006
- August 2006
- July 2006
- June 2006
- May 2006
- April 2006
- March 2006
- February 2006
- January 2006
- December 2005
- November 2005
- October 2005
- September 2005
- August 2005
- July 2005
 Eddy Elfenbein is a Washington, DC-based speaker, portfolio manager and editor of the blog Crossing Wall Street. His