Archive for January, 2008
-
Make Up Your Mind
Eddy Elfenbein, January 3rd, 2008 at 8:02 pm“Stock Futures Point to Further Decline”
–headline, Associated Press, Jan. 3, 7:02 a.m.
“Stock Futures Point to Flat Open”
–headline, Associated Press, Jan. 3, 8:22 a.m.
“Stock Futures Point to Higher Open”
–headline, Associated Press, Jan. 3, 9:21 a.m.
(via: BOTW) -
Bed Bath & Beyond’s Earnings
Eddy Elfenbein, January 3rd, 2008 at 5:56 pmBed Bath & Beyond (BBBY) just reported earnings for their third quarter. This is the one that ended in November so the holiday sales aren’t included.
I’ve been a defender of BBBY—and I still like and own it—but this report isn’t a good one. Sales rose by 10.8%. Operating and net earnings are down from last year, but thanks to share buybacks, the per-share numbers are up slightly. EPS rose 4.6% from 49.86 cents to 52.16 cents. The market was expecting 52 cents a share.
BBBY has been pouring money heavily into share buybacks. The number of diluted shares has dropped by 7.2% over the past four quarters. Although sales rose by 10.8%, sales-per-share rose by 19.5%. That’s the good part. The bad part is they’re paying for those sales with lower margins. This is the ninth straight quarter of lower net profit margins, although margins are still higher then they were in 2001.
Decreasing margins are rough for any business. To show you what I mean, let’s compare this past quarter with the Q3 from two years ago.
Net margins dropped from 9.29% to 7.70%. That’s a rate drop of 17.12%, which means that you have to increase sales by over 20% just to stay flat. Total sales rose 23.89% and diluted shares dropped 11.98%. Put it all together and you get an EPS increase of 16.66%. That’s the kind of headwind they’re running against.
Now for the bad news. Wall Street was expecting Q4 earnings of 78 cents a share. BBBY said it will be between 64 and 67 cents a share.For the fiscal fourth quarter of 2007, ending March 1, 2008, the Company estimates it will earn approximately $.64 to $.67 per diluted share based, in part, upon a projected flat comparable store sales percentage for the quarter. This would bring the Company’s full year earnings estimate to a range from approximately $2.08 to $2.11 per diluted share. The fiscal 2007 fourth quarter and full year have one less week than last year’s corresponding periods, as fiscal 2006 was a fifty-three week year.
Here are the earnings results going back a few years:
Quarter Sales Gross Profit Operating Profit Net Profit EPS $356,633 $146,214 $28,015 $17,883 $0.06 $451,715 $185,570 $53,580 $33,247 $0.12 $480,145 $196,784 $50,607 $31,707 $0.11 $569,012 $238,233 $77,138 $48,392 $0.17 $459,163 $187,293 $36,339 $23,364 $0.08 $589,381 $241,284 $70,009 $43,578 $0.15 $602,004 $246,080 $64,592 $40,665 $0.14 $746,107 $311,802 $101,898 $64,315 $0.22 $575,833 $234,959 $45,602 $30,007 $0.10 $713,636 $291,342 $84,672 $53,954 $0.18 $759,438 $311,030 $83,749 $52,964 $0.18 $879,055 $370,235 $132,077 $82,674 $0.28 $776,798 $318,362 $72,701 $46,299 $0.15 $903,044 $370,335 $119,687 $75,459 $0.25 $936,030 $386,224 $119,228 $75,112 $0.25 $1,049,292 $443,626 $168,441 $105,309 $0.35 $893,868 $367,180 $90,450 $57,508 $0.19 $1,111,445 $459,145 $155,867 $97,208 $0.32 $1,174,740 $486,987 $161,459 $100,506 $0.33 $1,297,928 $563,352 $231,567 $144,248 $0.47 $1,100,917 $456,774 $128,707 $82,049 $0.27 $1,273,960 $530,829 $189,108 $120,008 $0.39 $1,305,155 $548,152 $190,978 $121,927 $0.40 $1,467,646 $650,546 $283,621 $180,980 $0.59 $1,244,421 $520,781 $150,884 $98,903 $0.33 $1,431,182 $601,784 $217,877 $141,402 $0.47 $1,448,680 $615,363 $205,493 $134,620 $0.45 $1,685,279 $747,820 $304,917 $197,922 $0.67 $1,395,963 $590,098 $148,750 $100,431 $0.35 $1,607,239 $678,249 $219,622 $145,535 $0.51 $1,619,240 $704,073 $211,134 $142,436 $0.50 $1,994,987 $862,982 $309,895 $205,842 $0.72 $1,553,293 $646,109 $154,391 $104,647 $0.38 $1,767,716 $732,158 $211,037 $147,008 $0.55 $1,794,747 $747,866 $203,152 $138,232 $0.52 From the conference call, here’s Senior of Investor Relations Ronald Curwin discussing Q4:
As we said in September the business environment remains challenging particularly in areas most affected by housing market issues. Concerns about the economy, consumer spending, energy prices, housing and credit availability in particular persist. Recall that in last year’s fourth quarter we reported earnings per share of $0.72 per share which included a $0.07 per share non recurring charge. Excluding this non recurring charge earnings per share for the fourth quarter fiscal 2006 would have been reported at $0.79 per share. Also affecting the comparability of our fourth quarter 2007 earnings is that last year’s fourth quarter include 14 weeks of sales including the week after Thanksgiving versus this year’s fourth quarter that will have 13 weeks of sales excluding the week after Thanksgiving. The exclusion of the week after Thanksgiving in this year’s fourth quarter will have a negative impact on net sales of approximately $175 million when compared to the fourth quarter of last year.
Assuming a relatively flat comp stores sales percentage for the fiscal fourth quarter and concerting one less week of sales a year ago resulting from the current year calendar shift we anticipate a 2 to 4% percentage decrease in net sales and we would now estimate fourth quarter earnings in the range of from $0.64 to $0.67 per diluted share which would bring the full year’s earnings estimate in the range of from $2.08 to $2.11 per diluted share.By the way, BBBY doesn’t take questions during their calls. C’mon fellas, remember who owns the company!
-
No Change for the SPX
Eddy Elfenbein, January 3rd, 2008 at 4:30 pmFor the first time in five years, the S&P 500 registered no change for the day. Yesterday and today, we closed at 1447.16. The Dow, however, rose 12.76 points and the Nasdaq dropped 6.95 points.
The last time the S&P 500 had no change for the day was January 10, 2003. Before that was January 28, 1997. Many years ago, no change days were more frequent, but that’s obviously true when you’re dealing with a low number. For example, there were 11 such days in 1954 when the index was around 30. We’re only had four in the last 19 years.
Interestingly, the Dow had back-to-back closings at 2999.75 on July 16-17, 1990. That turned out to be the market’s high before we entered a nasty bear market. -
2007 in One Graph
Eddy Elfenbein, January 3rd, 2008 at 2:32 pmHere’s an interesting graph. This is the relative performance of the ten industry groups in the S&P 500. Talk about a wide divergence! Eight of the ten groups outperformed the index. The other two, financials and consumer discretionary (as in homebuilders), dramatically underperformed.
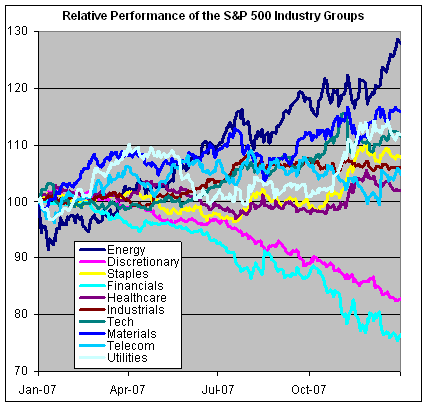
One more thing. Notice how smooth the discretionary line is. That’s why quantifying risk is such a hard game to play. -
About That $100 Oil Trade
Eddy Elfenbein, January 3rd, 2008 at 11:12 amThe big news yesterday was that oil hit $100 a barrel even though it was just one trade. Now it looks like the trade was done by a guy so he could…tell his grandchildren.
An independent trader ‘seeking his moment of fame’ caused oil prices to hit unprecendented levels of $100-a-barrel yesterday following a single deal.
The buyer, who was trading on his own money bought 1,000 barrels of crude oil from a colleague, which is the minimum allowed.
Strangely, he then sold then back almost immediately, making a loss of $600. The move left industry insiders questioning the reasons behind the deal.
Stephen Schork, a former trader at Nymex and editor of the oil market Schork Report told the Financial Times: “A local trader just spent about $600 in a trading loss to buy the right to tell his grandchildren he was the one who did it.
“Probably he is framing right now the print reflecting the trade,” he added. -
Pat Robertson Predicts Stock Market Crash
Eddy Elfenbein, January 3rd, 2008 at 10:23 amReligious broadcaster Pat Robertson predicted Wednesday that 2008 will be a year of violence worldwide and a recession in the United States, followed by a major stock-market crash by 2010.
Sharing what he believes God has told him about the year ahead is an annual tradition for Robertson.However, God/Robertson’s track record isn’t what you would expect.
Last year, Robertson predicted that a terrorist act, possibly involving a nuclear weapon, would result in mass killing in the United States. Noting that it hadn’t come to pass, Robertson said, “All I can think is that somehow the people of God prayed and God in his mercy spared us.”
That’s all he can think of?
-
Oh Erin!
Eddy Elfenbein, January 3rd, 2008 at 8:24 am
We already caught you.
Update: From Men’s Health, 8 Ways to Impress Me By Erin Burnett (via Deal Breaker) -
How to Spot a Market Top
Eddy Elfenbein, January 3rd, 2008 at 7:08 amEver heard the saying, “they don’t ring a bell at the top?”
Think again.“Stock” beats “sex” in Google China keyword searches
BEIJING (Reuters) – The names of three banks and the word “stocks” beat “sex” to become four of the most Googled words in China last year, according to a Google China list seen on Thursday.
China Merchants Bank, Industrial and Commercial Bank of China and China Construction Bank ranked second, third and sixth, according to a list supplied by Google China on its website (www.google.cn).
“On the Chinese mainland, it was money and technology that took the honours last year,” the China Daily said, pointing out that “sex” was the most popular keyword for Google users in some other countries.
Fourth on the list was “stock”, not surprising with Shanghai shares having risen 97 percent last year. At number 1 was “QQ”, a Chinese instant message service and a brand of car.
China’s Central Bank, the Ministry of Finance and Banking Regulatory Commission ranked first, third and fifth in the “Most Popular Departments” list, the Web site said.
In another list named “qiu zhi”, or “seeking knowledge”, “what is a blue chip” and “how to invest in the stock market” were the most searched questions on Google in China, while “what is love” and “how to kiss” ranked top of the global list. -
One Day Down
Eddy Elfenbein, January 2nd, 2008 at 4:39 pmUgh, this is NOT how I wanted to start the year. Believe it or not, January 2 is historically the second best day of the year. Only October 20 has done better.
Every stock on the Buy List closed lower except for little Nicholas Financial (NICK). I told you it was cheap! All told, the Buy List was down 1.58% today compared with the S&P 500’s -1.44%.
The big news tomorrow will be earnings from Bed Bath & Beyond (BBBY). -
Investors Haven’t Done Well?
Eddy Elfenbein, January 2nd, 2008 at 3:10 pmIn fact, investors in stock have not done very well over the last decade. The S&P 500 rose by a cumulative total of 52.6 percent from December 1997 to December 2007. After adjusting for inflation, the increase was 17.3 percent, which translates into real growth of just 1.6 percent a year. Add in a dividend yield of approximately the same size and we get that the average real return on stocks over the last decade has been 3.2 percent, a bit lower than the yield available on inflation indexed government bonds at the time.
Actually, the equity premium of stocks over long-term Treasuries has been much lower than most people realize. From 1969 to 2005, it’s only been 1.7% annualized. (These numbers are from Ibbotson.) That means investors can reasonable expect nominal equity returns of around 6%.
On the other hand, according to standard valuation models, the market is still very much underpriced. It’s been so dramatic that we could be going through a major shift in equity valuations. This could be one of the big stories of this decade (and hopefully, a post).
Also, the equity premium series is very volatile, so a 10-year period of zero to no premium isn’t that unusual. The 70s were worse and even the 80s don’t look that amazing. Though I would quibble with Baker’s statement that investors haven’t done well. Over the last five years, the total return of the Wilshire 5000 is 93.1% or 14.1% annualized.
(Via Salmon)
- Load More
Does anyone have a suit of armor, jet skis and a blowtorch I can borrow/rent? There's an experiment I'm working on.
This is pretty amazing. US elections combined since 1924:
GOP: 1,058,301,749
DEM: 1,057,846,951
Oth: 88,548,252Unemployment spikes in Washington, DC
-
-
Archives
- April 2025
- March 2025
- February 2025
- January 2025
- December 2024
- November 2024
- October 2024
- September 2024
- August 2024
- July 2024
- June 2024
- May 2024
- April 2024
- March 2024
- February 2024
- January 2024
- December 2023
- November 2023
- October 2023
- September 2023
- August 2023
- July 2023
- June 2023
- May 2023
- April 2023
- March 2023
- February 2023
- January 2023
- December 2022
- November 2022
- October 2022
- September 2022
- August 2022
- July 2022
- June 2022
- May 2022
- April 2022
- March 2022
- February 2022
- January 2022
- December 2021
- November 2021
- October 2021
- September 2021
- August 2021
- July 2021
- June 2021
- May 2021
- April 2021
- March 2021
- February 2021
- January 2021
- December 2020
- November 2020
- October 2020
- September 2020
- August 2020
- July 2020
- June 2020
- May 2020
- April 2020
- March 2020
- February 2020
- January 2020
- December 2019
- November 2019
- October 2019
- September 2019
- August 2019
- July 2019
- June 2019
- May 2019
- April 2019
- March 2019
- February 2019
- January 2019
- December 2018
- November 2018
- October 2018
- September 2018
- August 2018
- July 2018
- June 2018
- May 2018
- April 2018
- March 2018
- February 2018
- January 2018
- December 2017
- November 2017
- October 2017
- September 2017
- August 2017
- July 2017
- June 2017
- May 2017
- April 2017
- March 2017
- February 2017
- January 2017
- December 2016
- November 2016
- October 2016
- September 2016
- August 2016
- July 2016
- June 2016
- May 2016
- April 2016
- March 2016
- February 2016
- January 2016
- December 2015
- November 2015
- October 2015
- September 2015
- August 2015
- July 2015
- June 2015
- May 2015
- April 2015
- March 2015
- February 2015
- January 2015
- December 2014
- November 2014
- October 2014
- September 2014
- August 2014
- July 2014
- June 2014
- May 2014
- April 2014
- March 2014
- February 2014
- January 2014
- December 2013
- November 2013
- October 2013
- September 2013
- August 2013
- July 2013
- June 2013
- May 2013
- April 2013
- March 2013
- February 2013
- January 2013
- December 2012
- November 2012
- October 2012
- September 2012
- August 2012
- July 2012
- June 2012
- May 2012
- April 2012
- March 2012
- February 2012
- January 2012
- December 2011
- November 2011
- October 2011
- September 2011
- August 2011
- July 2011
- June 2011
- May 2011
- April 2011
- March 2011
- February 2011
- January 2011
- December 2010
- November 2010
- October 2010
- September 2010
- August 2010
- July 2010
- June 2010
- May 2010
- April 2010
- March 2010
- February 2010
- January 2010
- December 2009
- November 2009
- October 2009
- September 2009
- August 2009
- July 2009
- June 2009
- May 2009
- April 2009
- March 2009
- February 2009
- January 2009
- December 2008
- November 2008
- October 2008
- September 2008
- August 2008
- July 2008
- June 2008
- May 2008
- April 2008
- March 2008
- February 2008
- January 2008
- December 2007
- November 2007
- October 2007
- September 2007
- August 2007
- July 2007
- June 2007
- May 2007
- April 2007
- March 2007
- February 2007
- January 2007
- December 2006
- November 2006
- October 2006
- September 2006
- August 2006
- July 2006
- June 2006
- May 2006
- April 2006
- March 2006
- February 2006
- January 2006
- December 2005
- November 2005
- October 2005
- September 2005
- August 2005
- July 2005
 Eddy Elfenbein is a Washington, DC-based speaker, portfolio manager and editor of the blog Crossing Wall Street. His