Archive for 2011
-
The Tax Preference Economy
Eddy Elfenbein, May 18th, 2011 at 10:54 amHere’s an email from a reader on Google’s ($GOOG) tax strategy.
GOOG may not be betting on lower actual corporate tax rates. Like a lot of sophisticated U.S. companies that defer taxes by parking profits overseas, they may be waiting for the government to allow yet another “tax amnesty” repatriation scheme. That’s legislation that provides companies with a temporary period in which to repatriate assets while incurring lower taxes than they otherwise would. This has happened before, and there’s currently some lukewarm lobbying to make it happen again.
Tax deferral for profits held overseas is – for better or worse – most likely a HUGE part of why many major companies have been accumulating tons of cash on their balance sheets.
Tax preferences like this are lurking behind just about every weird financial distortion in the U.S. economy. Tax preferences for employer-provided healthcare. Tax preferences for interest on home mortgage indebtedness. Tax preferences for corporate debt over equity (that one’s debatable). Eventually, the muni market may be severely dislocated by the fact that municipal debt is overwhelmingly funded by a single class of investor: high-income individuals who justifiably wish to escape some income taxation on interest from municipal bonds. I haven’t seen anything particularly strange created by tax preferences for individual long-term cap gains over short-term cap gains, but I wouldn’t be surprised if it’s in there somewhere.
-
“What Is the Fed?” Starring Ben Bernanke
Eddy Elfenbein, May 18th, 2011 at 10:46 am -
The Breakdown in Cyclicals
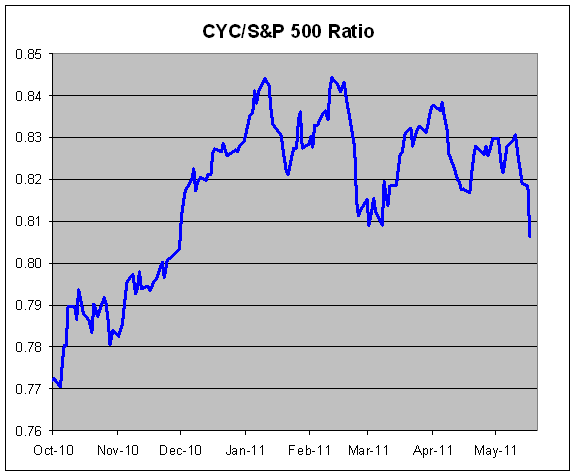
Eddy Elfenbein, May 18th, 2011 at 10:20 amI’ve been talking about the dangers in owning cyclical stocks and the breakdown is finally happening. Below is a chart of the Morgan Stanley Cyclical Index (^CYC) divided by the S&P 500. When the line is rising, cyclicals are outperforming. When it’s falling, cyclicals are trailing.
The ratio had an explosive rally beginning in March 2009 and it reached an all-time high on of 0.8441 January 10, 2011 before pulling back. The ratio rallied again and just barely made a new all-time high on February 11 of 0.8442. The new high was made by slightly more than one-ten-thousandth of a point.
In mid-February, cyclicals pulled back sharply then tried one more rally in March. Ultimately, the ratio failed to make a new high. But only in the last week have cyclicals started to fall apart.
The cyclicals have now trailed the S&P 500 for five straight days and yesterday was the worst day relative to the rest of the market in more than two-and-a-half months. While the S&P 500 lost just 0.04% yesterday, the CYC lost 1.51%. I think we’re in for a multi-year period of cyclical underperformance.
-
Morning News: May 18, 2011
Eddy Elfenbein, May 18th, 2011 at 7:46 amGreek Restructuring Rejected by ECB Officials in Clash With EU Politicians
Bank of England Voted 6-3 to Hold Rate on Consumer Risks
Malaysian Ringgit Advances as Growth, Inflation May Support Higher Rates
Europe Aims to Keep IMF Job After Strauss-Kahn
Crude Up On Weak Dollar Vs Euro; But Direction Lacking
Corn Climbs for Fifth Straight Day as Wet Weather May Delay U.S. Seeding
Dollar Mostly Weak but Rising Vs. Yen
Geithner Wants Debt Ceiling “Done and Clean” in July
New York AG Probes Banks Over Mortgage Securities
Staples 1Q Net Up 5% After Charges As Sales Edge Up; View Reduced
Dell Profits Soar As Company Continues Focus On Margins
Corporate Spending Gives Dell Edge Over HP
LinkedIn Raises Its IPO Price Range By $10 To $42-$45
For Buyers of Web Start-Ups, Quest to Corral Young Talent
Joshua Brown: Soros Plays Gold Like a Fiddle
Stone Street: Rolling Stones Hyperbole vs. Goldman Sachs Reality
Be sure to follow me on Twitter.
-
The Google Carry Trade
Eddy Elfenbein, May 17th, 2011 at 1:41 pmGoogle ($GOOG), which is some sort of technology outfit similar to Alta Vista, has decided to go to the bond market to raise $3 billion.
Here’s the odd bit: Google is sitting on $35 billion in cash. However, they can’t use most of that since it’s outside the U.S. (they funnel their money though Ireland). If Google repatriates those dollars, they’ll be hit with a massive tax bill. The company is probably assuming that the corporate tax rate will go down in the future and they’re probably right.
So it’s off to the bond market they go. Naturally, with all that cash, you can be pretty sure that Google is a good credit risk—and the bond market agrees.
The world’s biggest Internet-search company split the sale evenly between three-, five- and 10-year notes, according to data compiled by Bloomberg. The 1.25 percent, three-year notes yield 33 basis points more than similar-maturity Treasuries, the 2.125 percent, five-year debt pays a 43 basis-point spread, and the 3.625 percent, 10-year securities offer 58 basis points above benchmarks, Bloomberg data show.
Even though Google didn’t snag a AAA credit rating, the bond market gave them spreads as if they were AAA.
This is definitely a smart move by Google. Let’s look at Google’s earnings yield (which is the inverse of the P/E Ratio). Based on this year’s earnings estimate, Google’s earnings yield is 6.42%. Based on next year’s, it’s 7.48%. Even going by last year’s earnings, it’s still 5.60%.
In other words, Google’s yield on its equity is far higher than its yield on its debt. The lesson is to use debt. In fact, I think an interesting trade would be to play Google’s risk premium—go long Google’s stock and short the bonds. This is effectively what a company does when it issues bonds to buy back its stock (or in the 1980s when many companies LBO’d themselves).
-
Putting Our Debt In Context
Eddy Elfenbein, May 17th, 2011 at 11:35 amMegan McArdle passes this along from Dave Ramsey:
Altogether, the government has $14.2 trillion in debt. What would happen if John Q. Public and his wife called my show with these kinds of numbers? Here’s how their financial situation would stack up: If their household income was $55,000 per year, they’d actually be spending $96,500–$41,500 more than they made! That means they’re spending 175% of their annual income! So, in 2011 they’d add $41,500 of debt to their current credit card debt of $366,000!
-
The Tweet That Says It All
Eddy Elfenbein, May 17th, 2011 at 10:33 amJoe Weisenthal tweeted this earlier and I think it sums up the market’s view succinctly:
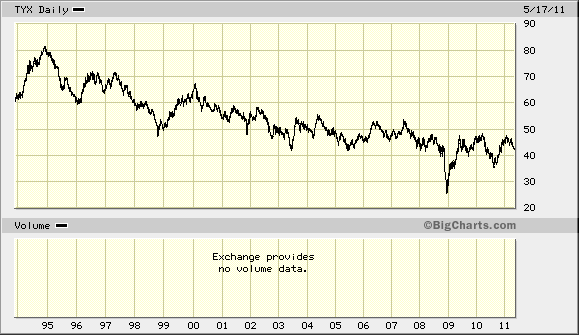
Crazy disconnect: Treasuries have been a killer trade for ages, yet there’s constant whining about Treasury holders getting screwed. $$
Except for the worst moments of the financial crisis, the yield on the 30-year Treasury bond has been on a constant downtrend for years.
-
HPQ Cuts Forecast, You Heard It Here First
Eddy Elfenbein, May 17th, 2011 at 9:30 amI often caution investors against investing by the numbers alone. Just because a stock has a low Price/Earnings Ratio or high Return-On-Equity doesn’t mean it’s a good buy. Those are often indicators of good buys but you need to look behind the numbers as well.
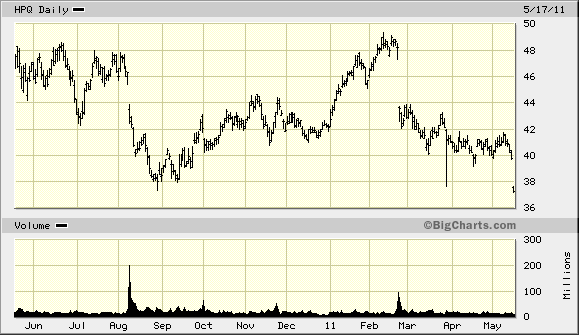
A good example of this came in February when shares of Hewlett-Packard ($HPQ) got hammered after its earnings report. A lot of people asked me if I thought HPQ was a good buy. This is what I had to say in my post Hewlett-Packard Is Cheap, For Good Reason:
Hewlett-Packard reported earnings of $1.36 per share which was seven cents more than Wall Street’s forecast. Wall Street responded by tossing the shares in the garbage. The shares dropped nearly 10% on Wednesday. Since the stock is a Dow component, the plunge distorted the entire index.
What freaked out Wall Street so much? Let’s dig into the numbers. The hitch was that quarterly revenue rose only 4% to $32.30 billion from $32.96 billion. Wall Street had been expecting $32.96 billion. In the wider scope of things, that’s really not a big miss, so what else was going on?
Hewlett-Packard also gave guidance for Q2 and the entire year. For this quarter, HPQ said it expects revenues between $31.4 billion and $31.6 billion, and earnings-per-share between $1.19 and $1.21. Wall Street didn’t like that at all. The consensus was for revenues of $32.6 billion and earnings of $1.25 per share.
HPQ’s full-year forecast (their fiscal year ends in October) was for total revenues between $130 billion and $131.5 billion. The consensus on Wall Street was for $132.91 billion. HPQ said it expects full-year earnings to range between $5.20 and $5.28 per share. The Street was expecting $5.23 per share, so I suppose that’s inline. HPQ has traditionally issued conservative forecasts so they can raise them later. Perhaps they’re doing that now to mask the poor Q2 guidance.
So this seems odd. It appears that HPQ gave lousy near-term guidance but the long-term guidance is still what the Street expects. Yet the stock’s popularity is somewhere between Kim Jong-il and Diphtheria. (Did Hurd get out at the right time? Sure looks like it.)
According to the company’s guidance, the stock is selling for just eight times earnings. The good sign is that their enterprise storage, servers and networking division saw its revenues increase by 22%. Also, the gross margins are up 1.5% to 23.4%.
The stock is tempting, but I’m still steering clear.
HPQ has a few problems to work through. They’re experiencing weakness in consumer PCs and services. I’m also not a big fan of the quality of their earnings. Always be wary when a company grows too much through acquisition. That’s often a sign of trouble. A company should be focused on making earnings not buying them.
I should add that things may change soon. On March 14th, Apotheker will unveil his business plan for Hewlett-Packard. (BTW, Léo, that shouldn’t take six months to do). I’m curious to hear what he has to say, but I don’t have enough confidence to buy before then. Until then, HPQ is a sell.
Sure enough, Hewlett-Packard cut that already-lowered forecast today. The company now says that sales for the year will be between $129 billion and $130 billion, and earnings will be $5 per share. Wall Street was expecting earnings for the May-June-July quarter of $1.23 per share. Instead, HPQ said it will be $1.08 per share.
Investors tend to think companies are like athletes and can shake off a bad night. Business generally doesn’t work that way. One problem leads to another problem and things can escalate very quickly. You should also be very skeptical of any company that relies on the strategy of “growth through acquisition.” Simply put, it rarely works.
-
Morning News: May 17, 2011
Eddy Elfenbein, May 17th, 2011 at 7:45 amGreek Government Notes Rise as Juncker Proposes ‘Soft’ Debt Restructuring
King Says Inflation Driven By Commodity Prices, to Rise Further
Tokyo Shares End Up As Yen Slip Masks Utilities Sell-Off
EU’s Van Rompuy Says Euro is Stable, ‘Too Strong’ Compared to China’s Yuan
Oil Drops for Second Day on Concern Over Greek Debt Crisis, U.S. Supplies
Gold Rises as Dollar Retreats From 7-week High
Nasdaq and ICE Drop Offer for NYSE Euronext
New York Investigates Banks’ Role in Fiscal Crisis
Wal-Mart Earnings Rise 3 Percent; U.S. Stores Still Slumping
Hewlett-Packard CEO Sees ‘Tough Third Quarter’
Rowan Slips After $1.1 Billion Sale of Manufacturing Unit
Home Depot Profit Meets Analyst Estimates
Home Depot Earnings Sum Up The Entire Economy
Jeff Miller: Understanding Economic Progress
Epicurean Dealmaker: Put Down Your Pitchforks
Be sure to follow me on Twitter.
-
The Magic Inflation Rate = 5.3%
Eddy Elfenbein, May 16th, 2011 at 10:15 pmI downloaded Professor Robert Shiller’s historical stock market data to see how inflation has impacted stock returns. I had done this before with data from Ibbotson. Those numbers go back to 1925, but Professor Shiller’s numbers go back to 1871.
I wanted to see how the stock market performed at different rates of inflation. I took the after-inflation total return of each month from 1871 through 2010.
I found that the magic number is 5.3%. If the annualized inflation rate for the month is under 5.3%, the stock market has performed very well. But when inflation is above 5.3%, the market does poorly. It’s pretty amazing how well this relationship has held up over 140 years. Historically, monthly inflation has been above 5.3% about one-third of the time.
My calculations show that when inflation is below 5.3%, the stock market has had an annualized after-inflation gain of 9.59%. When inflation is above 5.3%, then stock market has had an annualized loss of 8.15%. Stretched out over 140 years, that’s a loss of nearly 98%.
-
-
Archives
- April 2025
- March 2025
- February 2025
- January 2025
- December 2024
- November 2024
- October 2024
- September 2024
- August 2024
- July 2024
- June 2024
- May 2024
- April 2024
- March 2024
- February 2024
- January 2024
- December 2023
- November 2023
- October 2023
- September 2023
- August 2023
- July 2023
- June 2023
- May 2023
- April 2023
- March 2023
- February 2023
- January 2023
- December 2022
- November 2022
- October 2022
- September 2022
- August 2022
- July 2022
- June 2022
- May 2022
- April 2022
- March 2022
- February 2022
- January 2022
- December 2021
- November 2021
- October 2021
- September 2021
- August 2021
- July 2021
- June 2021
- May 2021
- April 2021
- March 2021
- February 2021
- January 2021
- December 2020
- November 2020
- October 2020
- September 2020
- August 2020
- July 2020
- June 2020
- May 2020
- April 2020
- March 2020
- February 2020
- January 2020
- December 2019
- November 2019
- October 2019
- September 2019
- August 2019
- July 2019
- June 2019
- May 2019
- April 2019
- March 2019
- February 2019
- January 2019
- December 2018
- November 2018
- October 2018
- September 2018
- August 2018
- July 2018
- June 2018
- May 2018
- April 2018
- March 2018
- February 2018
- January 2018
- December 2017
- November 2017
- October 2017
- September 2017
- August 2017
- July 2017
- June 2017
- May 2017
- April 2017
- March 2017
- February 2017
- January 2017
- December 2016
- November 2016
- October 2016
- September 2016
- August 2016
- July 2016
- June 2016
- May 2016
- April 2016
- March 2016
- February 2016
- January 2016
- December 2015
- November 2015
- October 2015
- September 2015
- August 2015
- July 2015
- June 2015
- May 2015
- April 2015
- March 2015
- February 2015
- January 2015
- December 2014
- November 2014
- October 2014
- September 2014
- August 2014
- July 2014
- June 2014
- May 2014
- April 2014
- March 2014
- February 2014
- January 2014
- December 2013
- November 2013
- October 2013
- September 2013
- August 2013
- July 2013
- June 2013
- May 2013
- April 2013
- March 2013
- February 2013
- January 2013
- December 2012
- November 2012
- October 2012
- September 2012
- August 2012
- July 2012
- June 2012
- May 2012
- April 2012
- March 2012
- February 2012
- January 2012
- December 2011
- November 2011
- October 2011
- September 2011
- August 2011
- July 2011
- June 2011
- May 2011
- April 2011
- March 2011
- February 2011
- January 2011
- December 2010
- November 2010
- October 2010
- September 2010
- August 2010
- July 2010
- June 2010
- May 2010
- April 2010
- March 2010
- February 2010
- January 2010
- December 2009
- November 2009
- October 2009
- September 2009
- August 2009
- July 2009
- June 2009
- May 2009
- April 2009
- March 2009
- February 2009
- January 2009
- December 2008
- November 2008
- October 2008
- September 2008
- August 2008
- July 2008
- June 2008
- May 2008
- April 2008
- March 2008
- February 2008
- January 2008
- December 2007
- November 2007
- October 2007
- September 2007
- August 2007
- July 2007
- June 2007
- May 2007
- April 2007
- March 2007
- February 2007
- January 2007
- December 2006
- November 2006
- October 2006
- September 2006
- August 2006
- July 2006
- June 2006
- May 2006
- April 2006
- March 2006
- February 2006
- January 2006
- December 2005
- November 2005
- October 2005
- September 2005
- August 2005
- July 2005


 Eddy Elfenbein is a Washington, DC-based speaker, portfolio manager and editor of the blog Crossing Wall Street. His