Archive for March, 2013
-
Morning News: March 8, 2013
Eddy Elfenbein, March 8th, 2013 at 6:07 amChina February Exports Surge, Supports Recovery Hopes
Japan’s Nakao Defends Easing as China’s Chen Expresses Concern
Abe Adviser Says Japan Can Forgo 2% Inflation If Economy Heals
ECB Chief Plays Down Italy Fears
Norway Oil Fund Posts Second-Best Year on Stock Market Rally
Jobless Claims Fall Unexpectedly
Warren Starts Taking On Banks And Regulators
Banks Pass Fed’s Tests; Critics Say It Was Easy
Pandora CEO’s Surprise Exit Overshadows Upbeat Results
Offshore Cash Hoard Expands by $183 Billion at Companies
For Icahn, a Game of Chicken With Dell’s Board
BofA Looks To Play Catch-Up in Asia Corporate Banking
In a Spinoff of Time Inc., Evolution Is Complete
Value Of U.S. Dollar Plummets After Joe Flacco Signs NFL’s Richest Contract
Joshua Brown: Scott Minerd: Here’s What Happens When Rates Rise
Edward Harrison: Achuthan: The US Has Been In A Recession For Three Quarters Of A Year Already
Be sure to follow me on Twitter.
-
Dow 36,000 Returns
Eddy Elfenbein, March 7th, 2013 at 3:12 pmJames Glassman, the co-author of Dow 36,000, returns today to explain what he got wrong and why the Dow can still make it to 36,000:
First, investors have become more frightened of stocks, not less — as reflected in a higher equity risk premium, the excess return that investors demand from stocks over bonds.
(…)
The heightened fears of investors are reflected in lower valuations. Currently, for example, the forward P/E ratio (based on estimated earnings for the next 12 months) of the Standard & Poor’s 500 Index is about 14. In other words, the earnings yield for a stock investment averages 7 percent (1/14), but the yield on a 10-year Treasury bond is only 1.9 percent — a huge gap. Judging from history, you would have to conclude that bonds are vastly overpriced, that stocks are exceptionally cheap or that investors are scared to death for a good reason. Maybe all three.
One way stocks could jump to 36,000 quickly would be for fears to subside and P/E ratios to rise. Assume that earnings yields fall to 5 percent. That would mean P/E ratios would go to 20, a boost of 50 percent in stock prices, assuming constant earnings.
The second thing that’s been unexpected since our book came out is that U.S. growth has drastically slowed. Instead of the historic rate of 3 percent, or our projected rate of 2.5 percent, actual annual real GDP increases from the end of 1999 to the end of 2012 averaged just 1.8 percent. Inflation was lower than normal, too, so the nominal rate of growth was only about 4 percent, instead of about 6 percent.
I still think Glassman is wrong about why he was wrong. Nine years ago, I explained why the logic behind Dow 36,000 was off base, and it’s been largely ignored by everyone.
With some false modesty, I think I’m the only one who’s been able to explain why 36,000 doesn’t work. Here’s my original article:
Now that the Dow Jones Industrial Average has soared over 4,500 points since Alan Greenspan warned us of the market’s “irrational exuberance,” a mini-industry has evolved of publishing books that attempt to explain the “new market.” The latest addition to the genre is Dow 36,000 by James K. Glassman and Kevin A. Hassett, both of the American Enterprise Institute. To give you an idea of how crowded the field is becoming, two other books are titled Dow 40,000 and Dow 100,000.
Unfazed by the Dow’s stunning climb, mega-bulls Glassman and Hassett have developed their own theory as to why the market has risen so much and why it will continue to rise. Their theory isn’t the usual litany one hears from Wall Street bulls (demographics, triumph of capitalism). Instead, their “36,000” theory goes right to the heart of investment analysis by questioning one of its elemental suppositions: namely, the idea that investments in stocks should demand a premium over investments in bonds due to the riskier nature of stocks. This isn’t split hairs they’re taking on.
Reciting historical data, Glassman and Hassett show that over the long haul, there is no difference between the risks of stocks and Treasury bonds. Therefore, they reason, there should be no risk premium at all. The authors claim that with the risk premium excised from the market, the perfectly reasonable price, or PRP as they call it, for the Dow is 36,000 (more on that later). Mind you, they’re not merely saying the Dow will eventually hit this magic number sometime in the future. Instead, Glassman and Hassett claim that 36,000 is where the Dow ought to be right now. Or more precisely, that’s where the Dow should have been early this year when they started writing the book. Could they be onto something? At the time, the Dow was at 9000.
The Dow very well may head to 36K, but it will have little to do with Glassman and Hassett’s theory. Their theory is seriously flawed due to major methodological errors.
First, Glassman and Hassett err in their selection of an appropriate measure of risk for their purpose. The free market prices risk, just like it prices everything else. That price is included in the price of stocks. In order to measure risk, Glassman and Hassett should use a measurement that isolates risk from the price of stocks. They don’t do this. Instead, they compare the standard deviation of stock returns to the standard deviation of risk-free-bond returns. That’s a different animal. Sure enough, with progressively longer holding periods, stock returns’ standard deviations gradually get smaller. Upon realizing that at long term, the standard deviation of stock returns is the same as bond returns’, actually slightly less, Glassman and Hassett conclude that stocks are “no more risky” than Treasury bonds.
That’s a faulty conclusion. Even if the standard deviations are the same size, it doesn’t say anything about the risk that they’re looking for. The point is that risk has still never been isolated: it’s inside those returns no matter how long-term you go. The variability of risk’s part of all these returns may be diminishing as well. That can happen even if risk stays exactly the same size. With Glassman and Hassett’s method, we have no idea how big the risk inherent in stock ownership is.
Without all the mumbo-jumbo, think of two houses, identical in every way except one has a great view of the river; the other does not. How much does the river view cost? Easy. Compare the prices of the two homes, and the difference must be the price of the view. The fact that the prices paid may deviate from their own respective averages the same way speaks nothing as to the price of the view. Glassman and Hassett are saying that since those deviations are the same, the river view is free.
Running with this assumption, Glassman and Hassett reason that since risk and reward are related, assets with the same risk will have the same return. Therefore, stocks and bonds will have the same returns. For this to happen, they claim, “the Dow should rise by a factor of four.” How do they get four?
Glassman and Hassett start with the “Old Paradigm” premise that bond returns plus a risk premium equals stock returns. With the risk premium “properly” removed, the yield on Treasuries—meaning their expected return—should be the same as the expected return for stocks. And that’s their dividend yield plus the dividend’s growth rate. So far, so good. Since the sum of these two is now about 1.5% above today’s Treasury yield, the yield on stocks needs to be adjusted downward in order to bring everything into balance. Specifically, it needs to drop from about 2% to 0.5%. With the yield dropping to one-fourth its previous level, stock prices will jump fourfold. Presto. That’s how we get from 9000 to 36000.
Not exactly. The authors have made another mistake. It’s impossible to have a one-time-only ratcheting down of the market’s dividend yield. The reason is that if long-term stock returns don’t change, as the authors do assume, a lower dividend yield will always create a commensurate increase in the dividend growth rate. As a result, there will always be a new higher dividend whose yield will always be in need of being notched back down. And as a result, the dividend growth rate will increase, and the cycle will continue ad infinitum. The correct conclusion from their model is not a one-time-only fourfold increase in stocks, but one-time-only infinite increase in stocks. This means the authors are actually insufficiently bullish and, moreover, they’ve mistitled their book.
Fortunately, the second half of the book is the more valuable by far. Once the authors stop making theories, they start making some sense. In this section, the authors discuss how investors can capitalize on the continuing market boom. The authors estimate the market has another three to five years perhaps before 36K is reached. In any case, their strategies are rather conservative: Buy and hold, diversify, don’t trade too much, don’t let market fluctuations rattle you, don’t time the market. All perfectly sound ideas and not specifically dependent on “Dow 36,000.”
Glassman and Hassett also give the names of stocks and mutual funds they like. There’s nothing wrong with their stocks in the realm of theory, but readers definitely ought to avoid the authors’ so-called Perfectly Reasonable Prices, which invite comparison to the famous description of the Holy Roman Empire—not holy, not Roman, not an empire.
I’m not familiar with Kevin Hassett’s former work, but I’ve always liked James Glassman’s investing articles for The Washington Post. His articles are consistently incisive and informative. This book, however, is nothing of the sort. Dow 36,000 contains egregious errors and fallacious reasoning.
Still, I do admire their ambition. With this book, Glassman and Hassett challenged a well-entrenched perception of reality. Being that this perception underwrites trillions of dollars, it’s a very, very, very, well-entrenched perception. Glassman and Hassett lost, and they lost badly. Old paradigms die hard, but they do die.
-
The Breakdown in the XAU
Eddy Elfenbein, March 7th, 2013 at 11:31 amI’m not exactly sure what this means, but I’m struck by the dramatic plunge in the Philadelphia Gold and Silver Index ($XUA). This is an index of 16 precious metal mining stocks.
Since October the XAU hasn’t merely fallen but it’s practically plunged off a cliff. This is especially surprising since the XAU tends to be somewhat sympathetic with cyclical stocks. Not this time. The cyclicals have been doing well.
Obviously gold hasn’t been performing well but the drop in the XAU has been very dramatic. I think in some respects the last few months have been a microcosm of the stock market of the 1980s as gold has fallen and paper assets have thrived. There seems to be a divergence within cyclicals as the commodity-based ones have lagged the heavy industry sectors.
-
Morning News: March 7, 2013
Eddy Elfenbein, March 7th, 2013 at 6:05 amDraghi Confronts Italy Impact as ECB Seen Holding Rates
Bank Of England Reaches Fourth Anniversary Of Record Low Base Rates
Investors Thrilled as Shoppers Fill Europe’s Outlet Malls
BOJ Rejects Earlier Asset Purchases in Shirakawa Finale
Fed Says Economy Posted Modest Growth In January-February
Jobs, Factory Data Offer Hope For Economy
Time Warner Opts to Spin Off All Magazines
Adidas Committed to Reebok Brand in India
Dubai’s DP World Sells Hong Kong Logistics Assets
Dell Investors Making a Big, Risky Bet
Face-Lift at Facebook, to Keep Its Users Engaged
Cullen Roche: Richard Bernstein: 3 Signs to Watch for the Next Bear Market
Phil Pearlman: Why Are Most People Terrible Investors?
Be sure to follow me on Twitter.
-
The Derisking Program at AFLAC
Eddy Elfenbein, March 6th, 2013 at 1:44 pmOne of key aspects in understanding AFLAC ($AFL) is that the company has greatly reduced its exposure to problem areas around the world. I don’t believe the market fully sees this. Kriss Cloninger, AFLAC’s CFO, recently discussed their investment portfolio at Citi’s 2013 U.S. Financial Services Conference.
Now, let me discuss how we’ve substantially enhanced our investment portfolio over the last few years. From January 2008 to the end of 2012, we dramatically cut our holdings of sovereign and financial instruments in the PIGS countries. We’ve also lowered our investments in perpetual securities. And the successful derisking program that we completed in mid-2012 has enabled us to focus on enhancing portfolio quality.
The U.S. corporate bond program we initiated in the third quarter of 2012 continues to be an effective means for enhancing our new money yields in the Japan portfolio. You’ll recall in the last half of 2012, our objective was to invest roughly two-thirds of our investment cash flow and U.S. dollar denominated publicly traded corporate bonds and then hedged the currency risk on principal back to yen.
This successful investment program enabled us to surpass our budgeted new money yield for 2012. And it has also provided greater liquidity and enhanced the flexibility of our portfolio while increasing the opportunities to diversify our portfolio beyond JGBs.
At December 31, this U.S. corporate bond program represented about 6.2% of our total portfolio. In light of the success of the corporate bond program last year and strong credit fundamentals of the investment grade corporate credits, we intend to continue this program in the first quarter of this year. Consistent with our asset allocation program, we’ll balance these investments with some JGBs for diversification and liquidity as well as other investment opportunities as they arise.
Our ability to continue to implement new strategies is based on the evolving capabilities of the AFLAC global investment division. We’re going to continue to build this framework to support investments and newer asset classes and then move forward accordingly and we’ll update you on our progress with our analyst meeting in May.
We’ve defined our investment objectives as maximizing risk adjusted performance subject to our liability profile and capital requirements. It’s important to note that all of our strategies have been back tested against our capital ratios and the ratios we’re trying to achieve.
-
The Dow Breaks Nine Times Gold
Eddy Elfenbein, March 6th, 2013 at 10:51 amIn addition to making an all-time high yesterday, the Dow just reached another milestone — it’s now more than nine times gold.
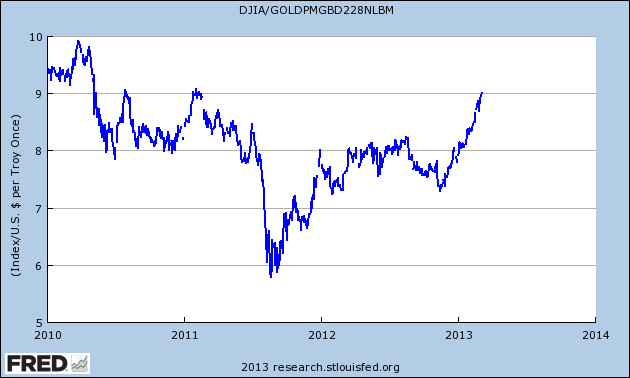
Peter Schiff, a well-known market bear and gold bug, said that gold and the Dow would eventually reach parity. The ratio reached a low of 5.7 eighteen months ago. In August 1999, the ratio peaked at 44.59.
-
The Market Extends Its Gains
Eddy Elfenbein, March 6th, 2013 at 9:58 amWall Street already has its eyes fixed on Friday’s jobs report. The expectation is for an increase of 170,000 nonfarm jobs and for 180,000 jobs in the private sector. We got a sneak preview this morning when ADP, the private payroll firm, said that 198,000 jobs were added last month. The Street had been expecting ADP to report 175,000 jobs. As we know, the Fed has based its exit from 0% on the employment reports. We still have a long way to go.
The good news this morning is helping the stock market extend its gain from yesterday’s record-beating day. The Dow is far from my favorite index; it’s price-weighted and only contains 30 stocks. That’s why I almost always refer to the S&P 500. Still, I understand the psychological impact of the oldest and best-known index finally breaking a new high.
For its part, the S&P 500 has been as high as 1,544.71 this morning so it’s not that far from the all-time high close from October 9, 2007 of 1,565.15. Several of our stocks like Fiserv, JPMorgan, Stryker and Cognizant Technologies are at or near 52-week highs this morning. JPM finally broke though $50 per share. I think the bank will increase its dividend by five cents per share very soon.

-
Morning News: March 6, 2013
Eddy Elfenbein, March 6th, 2013 at 6:10 amMerkel Looks East for Austerity Allies in Hollande Talks
ECB Battles Demons As Growth Slows
China Central Bank Eyes Reform, More Flexible Yuan In 2013
Australia Expands at Fastest Pace Since 2007 on Exports
Chavez’s 692% Bond Gain Seen Living On to Fidelity
Why Has Congress Left Housing to Fannie Mae and Freddie Mac?
As Fears Recede, Dow Industrials Hit a Milestone
Investors’ Quandary: Get In Now?
Samsung Gets A Foot In At Key Apple Supplier Sharp With $110 Million Investment
H-P, Dell Feel The Heat From Shareholders
Yahoo Says New Policy Is Meant to Raise Morale
Toyota Blinks on Camry Discounts After Sales Drop
Jeff Carter: Great Entrepreneurs Aren’t Born, They Are Made
Be sure to follow me on Twitter.
-
Stats on the Rally
Eddy Elfenbein, March 5th, 2013 at 1:19 pmI noticed that the S&P 500’s recent drop lasted from February 19th to February 26th. From top to bottom, the total loss came to 3.0001%.
I hate to go to the edge of any fair use laws, but this Bloomberg article has so many good bits, it’s hard not to quote it at length.
Almost $10 trillion has been restored to U.S. equities as retailers, banks and manufacturers led the recovery from the worst bear market since the 1930s. It took the Dow less than 65 months to rise above its previous high set on Oct. 9, 2007, more than a year faster than the recovery from the Internet bubble.
While the Dow has more than doubled in the four years since its bear-market low, its valuation remains 20 percent less than the price-earnings ratio at the previous peak and 15 percent below its 20-year average.
(…)
The gauge plunged 34 percent in 2008 for the worst performance in 77 years as the housing bubble burst and the U.S. financial system required a government bailout.
(…)
American Express Co., Caterpillar Inc. and Home Depot Inc. have led the Dow’s rally since its 2009 low, climbing more than 275 percent as the economy recovered from the worst recession in seven decades. Hewlett-Packard Co., the largest personal computer maker, is the only stock still in the 30-company gauge to fall since March 9, 2009. The shares tumbled 22 percent as mobile devices such as Apple Inc.’s iPad and iPhone began to compete with PCs. Exxon Mobil Corp., which has rallied 38 percent, is the second-worst performer since the gauge bottomed.
Bankruptcies and government bailouts helped make the Dow a different gauge than it was in 2007. Citigroup Inc., American International Group Inc. and General Motors Corp. were removed from the price-weighted average, while Cisco Systems Inc. and Travelers Cos. joined. Kraft Foods Inc., which took over AIG’s spot, was replaced by UnitedHealth Group Inc. last year after the food-maker split in two.
(…)
A rebound in corporate profits coupled with more than $2.3 trillion in Fed stimulus have pushed investors back into equities, sending the Dow up more than 116 percent from its March 2009 low of 6,547.05. The Standard & Poor’s 500 (SPX) Index is less than 3 percent below its record, reached the same day as the Dow.
The Dow surpassed its dot-com-era record on Oct. 3, 2006, 81 months after it peaked in January 2000. The measure had tumbled 38 percent from the 2000 high of 11,722.98 to its bottom on Oct. 9, 2002, as the Internet boom collapsed.
The gauge on average has taken about 6 1/2 years to return to previous record levels, according to data compiled by Bloomberg. Should the measure have followed that path, the Dow wouldn’t have posted a new record until the middle of 2014.
(…)
Dow profits are projected by analysts to increase 9.2 percent this year and 9 percent next year. Profit from companies in the S&P 500 will exceed $120 a share by next year, double the level in 2008, according to Wall Street estimates. That’s the biggest increase since the 142 percent gain amid the rally in technology stocks from 1993 to 1999.
The expansion in the Dow’s valuation since March 2009 has been slower than the S&P 500’s, while both are cheaper than 2007. The Dow’s trading at 13.8 times earnings in the last year, compared with a multiple of 17.1 at its 2007 peak and 25.9 when it reached a record in January 2000. The S&P 500’s multiple is about 15 times profit, compared with 17.5 on Oct. 9, 2007.
The operating margin, a measure of profitability, for S&P 500 companies is 19.9 percent after reaching 20.7 percent in August, the highest level in Bloomberg data going back to 1998.
-
Dilbert on Market Manipulation
Eddy Elfenbein, March 5th, 2013 at 12:00 pmScott Adams of Dilbert fame recently said he thought the stock market was due for a 20% slide. Our friends at Business Insider followed up to see why. Here’s Scott’s response:
Rob Wile at Businessinsider.com asked me to clarify my prediction of a 20% stock market correction in 2013. (See my post below.) So I tapped out the following message on my smartphone:
—- Start —-
“I’m glad you had the wisdom to get a cartoonist’s opinion on global financial markets.
The 20% estimate is based on the fact that 20 is a big round number and more likely to happen than 30%. I don’t like to over-think these things.
My reasoning is that the people at the highest levels of finance are brilliant people who chose a profession with the credibility of astrology. And they know it. Then they sell their advice to people who don’t know it. So that’s your cast of characters.
Now consider that the characters – who are literally geniuses in many cases – have an immense financial motive, opportunity, and a near-zero risk of getting caught. How do you think that plays out?
We can only give a guess of the odds that the market is being manipulated. So I ask myself: How often does the fox leave the hen house because he feels that taking an egg would be wrong?
If you have a different answer from mine, I applaud your faith in human nature.”
—– End —–
Personally, I think it’s funny if a bit overly cynical. Remember, of course, that the super geniuses are also battling each other which brings a certain level of accountability to any attempts at manipulation.
- Load More
Does anyone have a suit of armor, jet skis and a blowtorch I can borrow/rent? There's an experiment I'm working on.
This is pretty amazing. US elections combined since 1924:
GOP: 1,058,301,749
DEM: 1,057,846,951
Oth: 88,548,252Unemployment spikes in Washington, DC
-
-
Archives
- April 2025
- March 2025
- February 2025
- January 2025
- December 2024
- November 2024
- October 2024
- September 2024
- August 2024
- July 2024
- June 2024
- May 2024
- April 2024
- March 2024
- February 2024
- January 2024
- December 2023
- November 2023
- October 2023
- September 2023
- August 2023
- July 2023
- June 2023
- May 2023
- April 2023
- March 2023
- February 2023
- January 2023
- December 2022
- November 2022
- October 2022
- September 2022
- August 2022
- July 2022
- June 2022
- May 2022
- April 2022
- March 2022
- February 2022
- January 2022
- December 2021
- November 2021
- October 2021
- September 2021
- August 2021
- July 2021
- June 2021
- May 2021
- April 2021
- March 2021
- February 2021
- January 2021
- December 2020
- November 2020
- October 2020
- September 2020
- August 2020
- July 2020
- June 2020
- May 2020
- April 2020
- March 2020
- February 2020
- January 2020
- December 2019
- November 2019
- October 2019
- September 2019
- August 2019
- July 2019
- June 2019
- May 2019
- April 2019
- March 2019
- February 2019
- January 2019
- December 2018
- November 2018
- October 2018
- September 2018
- August 2018
- July 2018
- June 2018
- May 2018
- April 2018
- March 2018
- February 2018
- January 2018
- December 2017
- November 2017
- October 2017
- September 2017
- August 2017
- July 2017
- June 2017
- May 2017
- April 2017
- March 2017
- February 2017
- January 2017
- December 2016
- November 2016
- October 2016
- September 2016
- August 2016
- July 2016
- June 2016
- May 2016
- April 2016
- March 2016
- February 2016
- January 2016
- December 2015
- November 2015
- October 2015
- September 2015
- August 2015
- July 2015
- June 2015
- May 2015
- April 2015
- March 2015
- February 2015
- January 2015
- December 2014
- November 2014
- October 2014
- September 2014
- August 2014
- July 2014
- June 2014
- May 2014
- April 2014
- March 2014
- February 2014
- January 2014
- December 2013
- November 2013
- October 2013
- September 2013
- August 2013
- July 2013
- June 2013
- May 2013
- April 2013
- March 2013
- February 2013
- January 2013
- December 2012
- November 2012
- October 2012
- September 2012
- August 2012
- July 2012
- June 2012
- May 2012
- April 2012
- March 2012
- February 2012
- January 2012
- December 2011
- November 2011
- October 2011
- September 2011
- August 2011
- July 2011
- June 2011
- May 2011
- April 2011
- March 2011
- February 2011
- January 2011
- December 2010
- November 2010
- October 2010
- September 2010
- August 2010
- July 2010
- June 2010
- May 2010
- April 2010
- March 2010
- February 2010
- January 2010
- December 2009
- November 2009
- October 2009
- September 2009
- August 2009
- July 2009
- June 2009
- May 2009
- April 2009
- March 2009
- February 2009
- January 2009
- December 2008
- November 2008
- October 2008
- September 2008
- August 2008
- July 2008
- June 2008
- May 2008
- April 2008
- March 2008
- February 2008
- January 2008
- December 2007
- November 2007
- October 2007
- September 2007
- August 2007
- July 2007
- June 2007
- May 2007
- April 2007
- March 2007
- February 2007
- January 2007
- December 2006
- November 2006
- October 2006
- September 2006
- August 2006
- July 2006
- June 2006
- May 2006
- April 2006
- March 2006
- February 2006
- January 2006
- December 2005
- November 2005
- October 2005
- September 2005
- August 2005
- July 2005
 Eddy Elfenbein is a Washington, DC-based speaker, portfolio manager and editor of the blog Crossing Wall Street. His