CWS Market Review – March 11, 2025
(This is the free version of CWS Market Review. If you like what you see, then please sign up for the premium newsletter for $20 per month or $200 for the whole year. If you sign up today, you can see our two reports, “Your Handy Guide to Stock Orders” and “How Not to Get Screwed on Your Mortgage.”)
The stock market was hit hard yesterday. The Dow lost nearly 900 points. For the day, the S&P 500 lost 2.70%. That was the index’s largest loss for this year. It was also the third-largest daily loss in the last 2-1/2 years.
Going by intra-day levels, the S&P 500 got down to 9.7% below its intra-day high from last month. Since its peak, the S&P 500 has shed $4 trillion.
As we’ve seen in recent weeks, the selling was again mostly focused on riskier areas of the market. Value and low-volatility stocks fared much better; even so, many closed lower on the day.
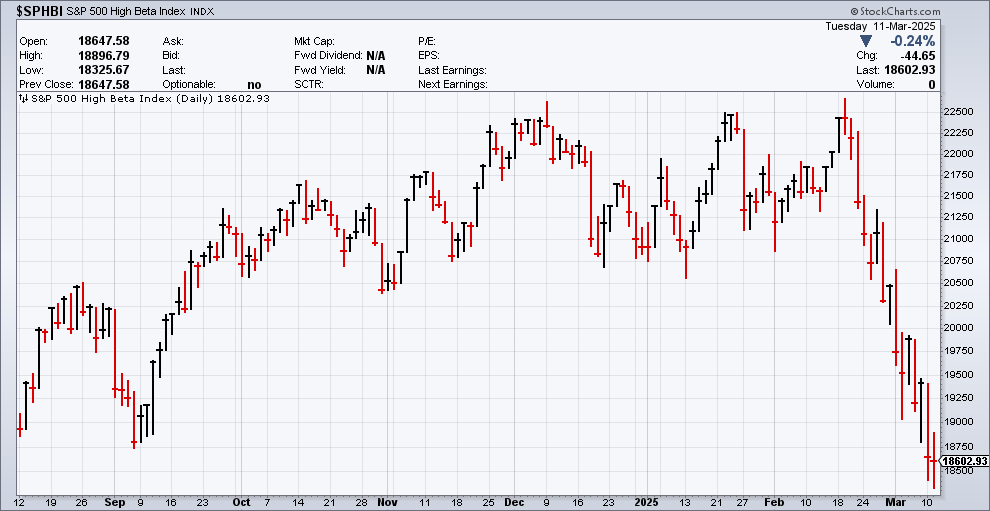
The Nasdaq Composite, for example, closed down 4% yesterday. Elon Musk’s Tesla (TSLA) was also the focus of many sellers. The EV stock is now down about half in the last several weeks. The S&P 500 High Beta Index is down 17% from its peak.
The message is clear. Folks are selling risk and buying safety. For example, Bitcoin is down 30% from its January peak. I’m pleased to say that our ETF is holding up much better than the rest of the market. The last three weeks have been some of our best weeks in terms of relative performance in years.
I know it sounds odd to say that we’re doing a lot less badly than everyone else. Still, from my experience, it’s the “less badly” part that separates good investors from the rest of the pack. In a bull market, everyone looks like a genius.
It seems like all the stocks that were working so well in December are now lagging and the stocks that had been trailing in December are now the hottest places to be. As we know well, the market has a mind of its own.
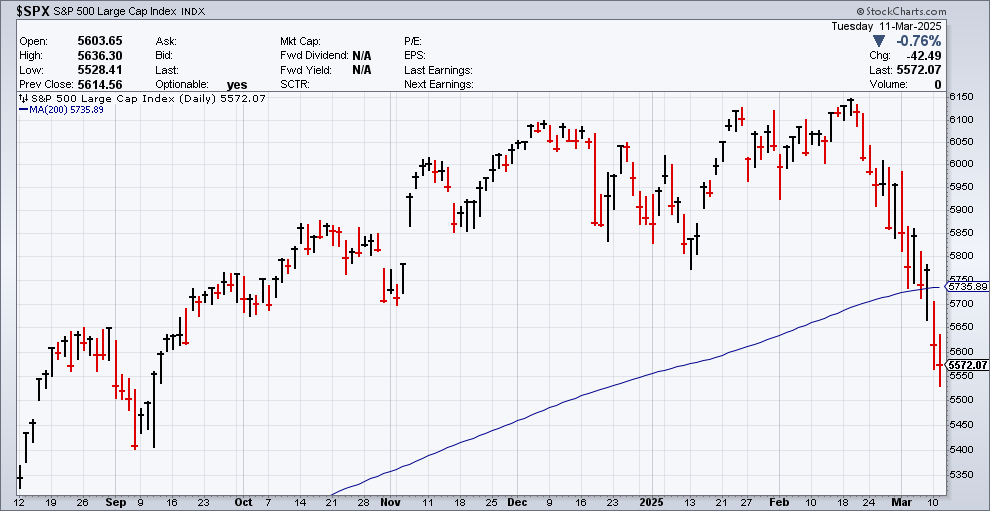
The stock market was down again today. At one point, the S&P 500 was down over 1.5% but it eventually closed down 0.76%. The S&P 500 reached its lowest closing level in six months. The index is also trading below its 200-day moving average (the blue line in the chart above). That’s often been a signal of more trouble ahead. Most of the high volatility days have come when the index is below its 200-DMA.
Here’s a look at the High Beta Index:
What’s the cause for the sudden jitters in the market? The top suspect appears to be President Trump’s trade policies, or perhaps it would be more accurate to say the uncertainty surrounding President’s Trump’s trade policies. Last month, the National Federation of Independent Business’ “Uncertainty Index” rose to its second-highest level since 1973. The percentage of small businesses who say now is a good time to expand posted its largest one-month drop since Covid.
More than once, the president has reversed himself or called for delays. I suspect that investors are growing frustrated with the ad hoc nature of these tariff polices. This morning, the president said he would double that tariff on Canadian steel and aluminum.
In addition to the uncertain policy risk, there’s also been some sluggish economic news. I want to be clear that it’s hardly bad news, but the economy may not be as strong as we believed.
The February Jobs Report Was OK But Not Great
On Friday, for example, we got the employment report from February, and it was decent but below expectations.
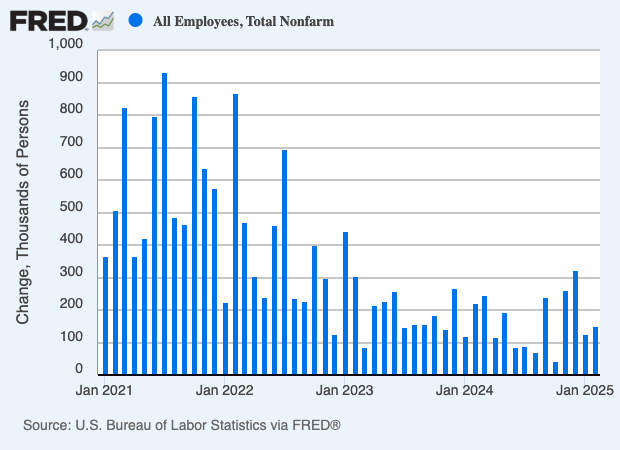
The government said that the U.S. economy created 151,000 net new jobs last month. Wall Street had been expecting an increase of 170,000 so that’s not a huge miss. The job gains figure for January was revised down to 125,000.
Average hourly earnings rose by 0.4%. That’s not bad, but it’s not much above inflation. The unemployment rate ticked up to 4.1%.
I was curious to see if the efforts of DOGE are present yet in the data. Last month, federal government employment fell by 10,000 while overall government employment increased by 11,000. We’ll probably have a better idea next month when the March jobs report comes out.
Here are some more details:
Health care led the way in job creation, adding 52,000 jobs, about in line with its 12-month average. Other sectors posting gains included financial activities (21,000), transportation and warehousing (18,000), and social assistance (11,000). Retail posted a decline of 6,000 workers.
On wages, average hourly earnings climbed 0.3%, as expected, though the annual increase of 4% was a bit softer than the 4.2% forecast.
Some of the details don’t look so hot. For example, the labor force participation rate fell 0.2% to 62.4%. That’s the lowest level in more than two years. The broader U-6 rate rose to its highest level since October 2021.
The household survey showed a loss of 588,000 jobs. The number of folks who have part-time work but are looking for full-time jobs rose by 460,000 to 4.9 million.
The Atlanta Fed’s GDPNow model currently expects Q1 GDP to shrink at a 2.4% rate. Polymarket, which lets investors buy futures on real world events, now sees a 41% chance of a recession this year.
One effect of this jobs report may be a more active Federal Reserve. Futures traders now expect three rate cuts this year whereas it was only two a few weeks ago.
The next test for the market will come tomorrow with the February CPI report. Wall Street expects an increase of 0.3% for both the core and headline rates. The 12-month rate is expected to be 3.2% for the core rate and 2.9% for the headline rate. Tomorrow’s report will be too soon to show any impact from the trade policies.
Time for SAIC to Shine?
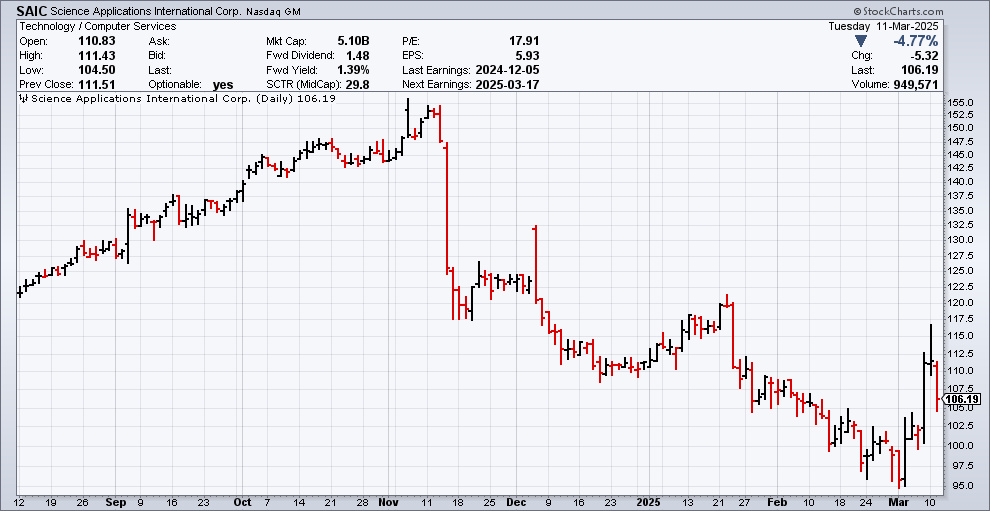
Next week, one of our Buy List stocks, Science Applications International (SAIC), is due to report its earnings. I highlight SAIC because it’s put up good results in recent quarters, but their stock has not done well.
In September, SAIC reported Q2 earnings of $2.05 per share. That was a 20-cent beat. Then in December, it reported Q3 earnings of $2.61 per share. That was a 44-cent beat.
Yet the stock started to fall since election day. In November, SAIC was as high as $156 per share. It recently dropped to $95 per share.
I assume that investors are nervous that its contracts will come under the DOGE knife. I’m not so sure of that. SAIC does a lot of private sector business, and it works with many foreign governments. Also, most of the company’s defense contracts are on high-tech systems which often help the Pentagon save money.
In December, SAIC’s board of directors authorized a buyback of $1.2 billion. That’s a strong show of confidence. At the end of last quarter, SAIC’s estimated backlog was approximately $22.4 billion.
SAIC also raised its guidance. The company sees its full-year earnings ranging between $8.50 and $8.65 per share. That’s a big increase over the previous guidance range of $8.10 to $8.30 per share. SAIC also narrowed its revenue range to between $7.425 and $7.475 billion.
For the year so far, SAIC has made $6.56 per share. That means the guidance implies Q4 earnings of $1.94 to $2.09 per share. Last Friday, the stock rose nearly 9% in trading. I think there’s a good chance we’ll see an upside surprise.
That’s all for now. There will be no newsletter next week. I’m going to be at the Future Proof Citywide investment conference in Miami Beach. If you’re around, please come by to say hello. It should be a lot of fun. We’ll be at booth #116.
– Eddy
Posted by Eddy Elfenbein on March 11th, 2025 at 7:12 pm
The information in this blog post represents my own opinions and does not contain a recommendation for any particular security or investment. I or my affiliates may hold positions or other interests in securities mentioned in the Blog, please see my Disclaimer page for my full disclaimer.
- Load More
Does anyone have a suit of armor, jet skis and a blowtorch I can borrow/rent? There's an experiment I'm working on.
This is pretty amazing. US elections combined since 1924:
GOP: 1,058,301,749
DEM: 1,057,846,951
Oth: 88,548,252Unemployment spikes in Washington, DC
-
-
Archives
- April 2025
- March 2025
- February 2025
- January 2025
- December 2024
- November 2024
- October 2024
- September 2024
- August 2024
- July 2024
- June 2024
- May 2024
- April 2024
- March 2024
- February 2024
- January 2024
- December 2023
- November 2023
- October 2023
- September 2023
- August 2023
- July 2023
- June 2023
- May 2023
- April 2023
- March 2023
- February 2023
- January 2023
- December 2022
- November 2022
- October 2022
- September 2022
- August 2022
- July 2022
- June 2022
- May 2022
- April 2022
- March 2022
- February 2022
- January 2022
- December 2021
- November 2021
- October 2021
- September 2021
- August 2021
- July 2021
- June 2021
- May 2021
- April 2021
- March 2021
- February 2021
- January 2021
- December 2020
- November 2020
- October 2020
- September 2020
- August 2020
- July 2020
- June 2020
- May 2020
- April 2020
- March 2020
- February 2020
- January 2020
- December 2019
- November 2019
- October 2019
- September 2019
- August 2019
- July 2019
- June 2019
- May 2019
- April 2019
- March 2019
- February 2019
- January 2019
- December 2018
- November 2018
- October 2018
- September 2018
- August 2018
- July 2018
- June 2018
- May 2018
- April 2018
- March 2018
- February 2018
- January 2018
- December 2017
- November 2017
- October 2017
- September 2017
- August 2017
- July 2017
- June 2017
- May 2017
- April 2017
- March 2017
- February 2017
- January 2017
- December 2016
- November 2016
- October 2016
- September 2016
- August 2016
- July 2016
- June 2016
- May 2016
- April 2016
- March 2016
- February 2016
- January 2016
- December 2015
- November 2015
- October 2015
- September 2015
- August 2015
- July 2015
- June 2015
- May 2015
- April 2015
- March 2015
- February 2015
- January 2015
- December 2014
- November 2014
- October 2014
- September 2014
- August 2014
- July 2014
- June 2014
- May 2014
- April 2014
- March 2014
- February 2014
- January 2014
- December 2013
- November 2013
- October 2013
- September 2013
- August 2013
- July 2013
- June 2013
- May 2013
- April 2013
- March 2013
- February 2013
- January 2013
- December 2012
- November 2012
- October 2012
- September 2012
- August 2012
- July 2012
- June 2012
- May 2012
- April 2012
- March 2012
- February 2012
- January 2012
- December 2011
- November 2011
- October 2011
- September 2011
- August 2011
- July 2011
- June 2011
- May 2011
- April 2011
- March 2011
- February 2011
- January 2011
- December 2010
- November 2010
- October 2010
- September 2010
- August 2010
- July 2010
- June 2010
- May 2010
- April 2010
- March 2010
- February 2010
- January 2010
- December 2009
- November 2009
- October 2009
- September 2009
- August 2009
- July 2009
- June 2009
- May 2009
- April 2009
- March 2009
- February 2009
- January 2009
- December 2008
- November 2008
- October 2008
- September 2008
- August 2008
- July 2008
- June 2008
- May 2008
- April 2008
- March 2008
- February 2008
- January 2008
- December 2007
- November 2007
- October 2007
- September 2007
- August 2007
- July 2007
- June 2007
- May 2007
- April 2007
- March 2007
- February 2007
- January 2007
- December 2006
- November 2006
- October 2006
- September 2006
- August 2006
- July 2006
- June 2006
- May 2006
- April 2006
- March 2006
- February 2006
- January 2006
- December 2005
- November 2005
- October 2005
- September 2005
- August 2005
- July 2005
 Eddy Elfenbein is a Washington, DC-based speaker, portfolio manager and editor of the blog Crossing Wall Street. His