CWS Market Review – March 25, 2025
(This is the free version of CWS Market Review. If you like what you see, then please sign up for the premium newsletter for $20 per month or $200 for the whole year. If you sign up today, you can see our two reports, “Your Handy Guide to Stock Orders” and “How Not to Get Screwed on Your Mortgage.”)
Here are some stats to consider: Since 1966, the S&P 500 has had 12 bull markets and 12 bear markets. Over that time, the market has been in a bull market 80.2% of the time, and in a bear market the other 19.8% of the time.
During bull markets, the index has had an annualized average gain of 21.2% per year. In bear markets, it’s lost an average of 35.5% per year. Notice how the bear markets are short but sharp while the bulls are long and slow. That’s one of the important truths about investing.
Here’s another way of thinking about it. Imagine that instead of investing, you went to a special roulette table once a year on December 31. This roulette table, however, has some unusual rules.
At our roulette table, you have an 80% chance of making 20% on your money for the coming year, and a 20% chance of losing one-third of your money for the year.
You may not think this is a very comforting game since you have a very real chance of losing one-third of your money in any given year.
While this roulette is a product of my imagination, the payoffs are close to accurate, and, as in real investing, the key strategy is to keep playing the game because the odds are very much in your favor. That’s why so much of successful investing comes down to doing little and waiting. For some people, that’s too much to bear.
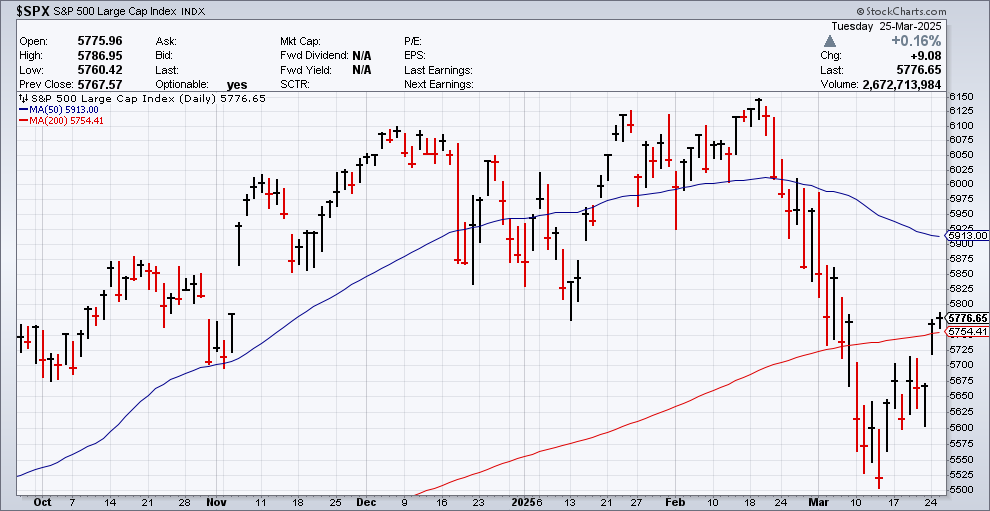
It’s easy to be reminded of this as the stock market recently had a very quick correction. The S&P 500 lost just over 10% in 16 trading days. I see plenty of folks debating whether we’re in a bear market or not, yet the market has already made back nearly half of what it lost.
This year’s bear market began five years to the date after the fantastic Covid-induced plunge of 2020. Five years ago, the market gave us a 20% surge in just three days, but 25 years ago, the market peaked on March 24, 2000. We didn’t reach another new high for 13 years.
SAIC Rallies on Earnings Beat
Two weeks ago, I told you about Science Applications International (SAIC) which is one of our Buy List stocks. I highlighted the company because the business performance has been quite good, but the stock has taken a big hit, especially since election day. I always pay attention when good stocks are taken down, especially for transient reasons.
Many investors suspected that SAIC’s contracts would be under the knife thanks to the new Department of Government Efficiency, but that’s an exaggerated threat. SAIC does so many things for the Pentagon. In fact, SAIC is ultimately a money saver for the DOD.
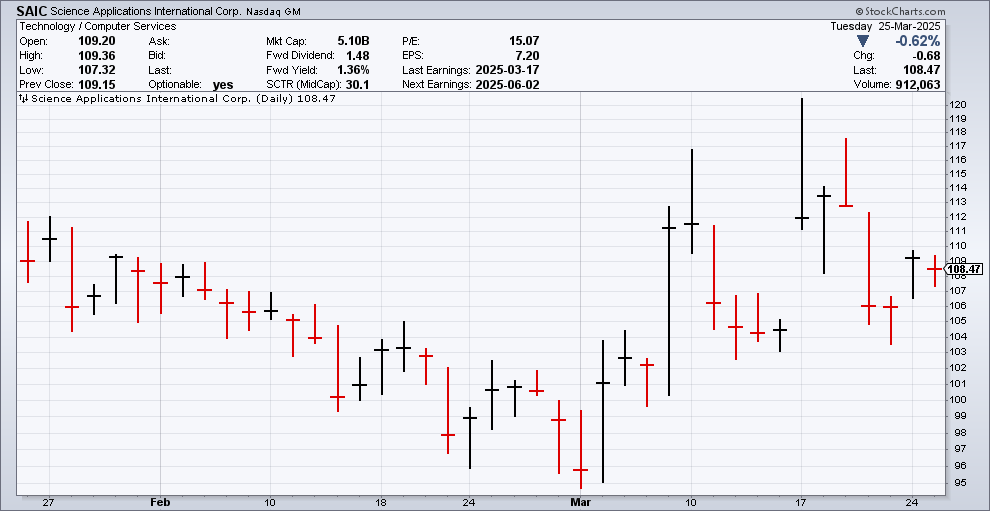
In September, SAIC reported fiscal Q2 earnings of $2.05 per share. That was a 20-cent beat. Then in December, it reported fiscal Q3 earnings of $2.61 per share. That was a 44-cent beat.
Yet the stock started to fall since election day. In November, SAIC was as high as $156 per share. Earlier this month, it dropped down to $95 per share. This is when prudent stock shoppers take notice.
We’ve been paying close attention to SAIC, and we’ve seen several reasons to keep the faith. For example, in December, SAIC’s board of directors authorized a buyback of $1.2 billion. That’s a strong show of confidence. At the end of last quarter, SAIC’s estimated backlog was approximately $22.4 billion.
SAIC had also raised its guidance. The company projected full-year earnings between $8.50 and $8.65 per share. That’s a big increase over the previous guidance range of $8.10 to $8.30 per share.
That brings us to the recent earnings report. For the year so far, SAIC has made $6.56 per share. That means the guidance implied Q4 earnings of $1.94 to $2.09 per share. Two weeks ago, I wrote, “I think there’s a good chance we’ll see an upside surprise.”
I was right.
Last Monday, SAIC said it made $2.57 per share. That’s up from $1.43 per share the year before. Quarterly revenues increased 5.8% to $1.84 billion.
For the year, SAIC made $9.13 per share. That’s up from $7.88 per share the prior year. The company had free cash flow of $499 million.
SAIC also raised guidance for the new fiscal year. The company now sees FY 2026 revenues ranging between $7.6 billion and $7.75 billion. That’s an increase of $50 million to the low end.
SAIC raised its full-year earnings guidance for the coming year to $9.10 to $9.30 per share. That’s an increase of 20 cents to both ends. On Monday after the earnings report, the stock rallied more than 7% for us. The stock closed today nearly 15% above its low from earlier this month. This is another good example of why it’s good to stand by high-quality stocks that run into a little trouble.
By the way, I talk more about our Buy List stocks like SAIC in our premium version which you can sign-up for here.
Consumer Confidence Plunges to 12-Year Low
Wall Street got an unpleasant shock this morning when a report on consumer sentiment dropped sharply. The Conference Board said its measure for future expectations fell 9.6 points to 65.2. That’s the lowest reading since late 2013. Traditionally, any reading below 80 has signaled that a recession is on its way.
The measure for current conditions fell 7.2 points to 92.9. Economists had been expecting a drop to 93.5. That was the index’s fourth monthly drop in a row.
I can’t say I’m completely surprised by this news. Just look at the stock market over the past month, and you can see that investors are clearly nervous. The report also shows that only 37.4% of respondents expect the stock market to be higher one year from today. That’s a drop of 10% in the last month. It’s also the first time that most investors are pessimistic since late 2023.
I’m a firm believer that the stock market is a driver of consumer spending (though not the only driver). Happy stocks make happy shoppers.
I looked at Polymarket today which is a site where you can bet on real world events. Bettors currently think there’s a 33% chance of a recession starting later this year. Bettors also expect growth for Q1 GDP to be about 1%. That’s not so good.
Traders think that the Fed will soon be back to cutting interest rates. The latest expectations are that the Fed will cut twice more this year, and there’s nearly a perfect 50-50 split on the need for a third rate cut.
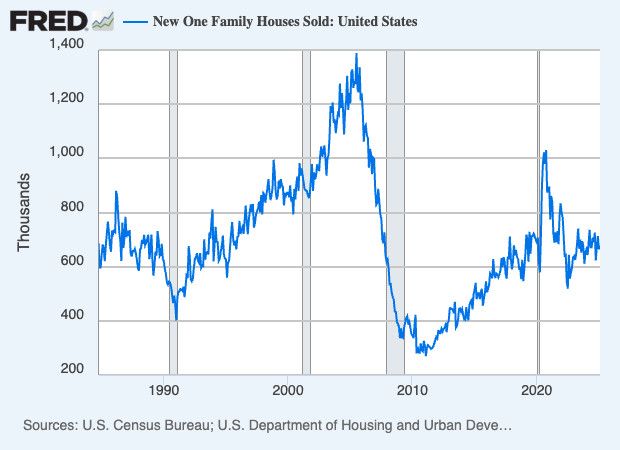
On the plus side, today’s new homes sales report showed a modest rebound last month. The Census Bureau said that new home sales rose 1.8% to an annualized rate of 676,000. The numbers for January were revised higher as well.
Is the U.S. stock market out of its hole? That’s hard to say. The correction was swift, and we’ve already made nearly half of it back. One good item is that the stock market just barely tipped above its 200-day moving average. This is a dumb rule that has a pretty good track record. Historically, the market has done much better when it’s traded above its 200-DMA compared to when it’s below the 200-DMA. Still, I don’t think we’re in the clear just yet.
The next big test for the market will come next Friday, April 4, with the March jobs report. The labor market has shown a little weakness lately but nothing alarming. At least, not yet.
That’s all for now. I’ll have more for you in the next issue of CWS Market Review.
– Eddy
Posted by Eddy Elfenbein on March 25th, 2025 at 5:11 pm
The information in this blog post represents my own opinions and does not contain a recommendation for any particular security or investment. I or my affiliates may hold positions or other interests in securities mentioned in the Blog, please see my Disclaimer page for my full disclaimer.
- Load More
Does anyone have a suit of armor, jet skis and a blowtorch I can borrow/rent? There's an experiment I'm working on.
This is pretty amazing. US elections combined since 1924:
GOP: 1,058,301,749
DEM: 1,057,846,951
Oth: 88,548,252Unemployment spikes in Washington, DC
-
-
Archives
- April 2025
- March 2025
- February 2025
- January 2025
- December 2024
- November 2024
- October 2024
- September 2024
- August 2024
- July 2024
- June 2024
- May 2024
- April 2024
- March 2024
- February 2024
- January 2024
- December 2023
- November 2023
- October 2023
- September 2023
- August 2023
- July 2023
- June 2023
- May 2023
- April 2023
- March 2023
- February 2023
- January 2023
- December 2022
- November 2022
- October 2022
- September 2022
- August 2022
- July 2022
- June 2022
- May 2022
- April 2022
- March 2022
- February 2022
- January 2022
- December 2021
- November 2021
- October 2021
- September 2021
- August 2021
- July 2021
- June 2021
- May 2021
- April 2021
- March 2021
- February 2021
- January 2021
- December 2020
- November 2020
- October 2020
- September 2020
- August 2020
- July 2020
- June 2020
- May 2020
- April 2020
- March 2020
- February 2020
- January 2020
- December 2019
- November 2019
- October 2019
- September 2019
- August 2019
- July 2019
- June 2019
- May 2019
- April 2019
- March 2019
- February 2019
- January 2019
- December 2018
- November 2018
- October 2018
- September 2018
- August 2018
- July 2018
- June 2018
- May 2018
- April 2018
- March 2018
- February 2018
- January 2018
- December 2017
- November 2017
- October 2017
- September 2017
- August 2017
- July 2017
- June 2017
- May 2017
- April 2017
- March 2017
- February 2017
- January 2017
- December 2016
- November 2016
- October 2016
- September 2016
- August 2016
- July 2016
- June 2016
- May 2016
- April 2016
- March 2016
- February 2016
- January 2016
- December 2015
- November 2015
- October 2015
- September 2015
- August 2015
- July 2015
- June 2015
- May 2015
- April 2015
- March 2015
- February 2015
- January 2015
- December 2014
- November 2014
- October 2014
- September 2014
- August 2014
- July 2014
- June 2014
- May 2014
- April 2014
- March 2014
- February 2014
- January 2014
- December 2013
- November 2013
- October 2013
- September 2013
- August 2013
- July 2013
- June 2013
- May 2013
- April 2013
- March 2013
- February 2013
- January 2013
- December 2012
- November 2012
- October 2012
- September 2012
- August 2012
- July 2012
- June 2012
- May 2012
- April 2012
- March 2012
- February 2012
- January 2012
- December 2011
- November 2011
- October 2011
- September 2011
- August 2011
- July 2011
- June 2011
- May 2011
- April 2011
- March 2011
- February 2011
- January 2011
- December 2010
- November 2010
- October 2010
- September 2010
- August 2010
- July 2010
- June 2010
- May 2010
- April 2010
- March 2010
- February 2010
- January 2010
- December 2009
- November 2009
- October 2009
- September 2009
- August 2009
- July 2009
- June 2009
- May 2009
- April 2009
- March 2009
- February 2009
- January 2009
- December 2008
- November 2008
- October 2008
- September 2008
- August 2008
- July 2008
- June 2008
- May 2008
- April 2008
- March 2008
- February 2008
- January 2008
- December 2007
- November 2007
- October 2007
- September 2007
- August 2007
- July 2007
- June 2007
- May 2007
- April 2007
- March 2007
- February 2007
- January 2007
- December 2006
- November 2006
- October 2006
- September 2006
- August 2006
- July 2006
- June 2006
- May 2006
- April 2006
- March 2006
- February 2006
- January 2006
- December 2005
- November 2005
- October 2005
- September 2005
- August 2005
- July 2005
 Eddy Elfenbein is a Washington, DC-based speaker, portfolio manager and editor of the blog Crossing Wall Street. His