-
Waiting on the Fed
Posted by Eddy Elfenbein on November 3rd, 2010 at 11:30 amNow that the election is finally past us, we can turn our attention to the Fed and the announcement that’s due at 2:15 pm. How big will QE2 be?
I can guarantee you that some commentators will see it as far too big while others will see it as far too small. I’m starting to expect that the Fed may use a two-part strategy to boost the “headline effect.” For example, they may announce $500 billion in Treasury purchases followed by $300 billion in purchases from the payments from their mortgage holdings. Something like that. But really, I just don’t know, though I suspect that the market will be disappointed.
The indexes are just about flat today. The election seems to have gone according to most expectations, so the market isn’t digesting any major surprises. There also isn’t much going on with the Buy List today. Most of our stocks are near flat. Stryker (SYK) is up about 2.9%, making it our best mover on the day. Currently, the Buy List is up 0.08% today compared with a loss of 0.35% for the S&P 500.
Stay tuned for the Fed!
-
Morning News: November 3, 2010
Posted by Eddy Elfenbein on November 3rd, 2010 at 7:27 amDollar Steady but Seen Undermined by Fed QE
Dollar Falls Versus Most Counterparts on Prospects for Fed Bond Purchases
Bernanke Faces Greater Scrutiny After Republican Election Gains
Global Markets Look Past U.S. Election to Fed
SEC Mulls Ban on Unfettered Access to Markets
San Francisco Bans Happy Meals
Cotton Clothing Price Tags to Rise
Aetna 3Q Net Up 53% On Gains, Lower Medical Costs; View Raised
-
Cyclicals Are Still Rich
Posted by Eddy Elfenbein on November 2nd, 2010 at 1:43 pmHere’s an admittedly crude metric I like to use to look at the valuation of cyclical stocks. These are stocks of companies whose businesses are closely tied to the economic cycle. This is the ratio of the Morgan Stanley Cyclical Index (^CYC) divided by the S&P 500:

In other words, when the line goes up, cyclicals are out-performing.
On April 26, the ratio closed at 0.8034, its highest reading ever. Since then, the ratio has moved down very slightly. In March of 2009, the ratio got to as low as 0.4184. Historically, when the cycle switches directions, it’s a big deal and it last for a few years (though not always).
The S&P 500 is currently trading around 1195. If it closes there, this would be the highest close since May 3 when the index was at 1202.26. The high for this year came on April 23 when the S&P 500 closed at 1217.28.
Even though the S&P 500 is still short of its high, the Dow is very close to making a new high. The Dow is currently at 11,217 which is higher than its April high close (which came on the 24th instead of the 23rd) at 11,205.03. The Dow is currently on track for its highest close since September 19, 2008 at 11,388.44.
-
With 0% of the Vote In….
Posted by Eddy Elfenbein on November 2nd, 2010 at 10:44 amWhile we’re all waiting for the election returns to come in, here are a few items I found interesting:
Bespoke has a great post that notes the divergence in the recent rally. The weaker dollar is helping more internationally-focused companies. As a result, stocks of companies with no foreign sales are up just 10.36%. But stocks with more than half their sales coming from outside the U.S. are up 17.55%.
Michael Stokes takes a look at trading gold using my gold model.
The latest Intrade data shows the GOP gaining 63.75 seats with a standard deviation of 11.3. That’s based on the 50-seat and 60-seat contracts. If we use the 60-seat and 70-seat contracts, it’s a gain of 64.3 seats with a standard deviation of 13.
The lede of this story sounds like it’s from a Carson monologue from 1986:
Gov. Arnold Schwarzeneger says welfare recipients can no longer use state-issued debit cards at medical marijuana shops, psychics and other businesses whose services have been deemed “inconsistent with the intent” of the program.
On November 5, 1974, Jerry Brown was first elected Governor of California. The Dow was at 674.75.
Check out Josh Brown’s great Star Wars-themed roundup of the financial blogosphere. I’m honored to have been named a Jawa.
-
It’s Mid-Termania!
Posted by Eddy Elfenbein on November 2nd, 2010 at 10:23 amThe market is up again today but don’t get too excited. We had trouble holding on to gains yesterday which is exactly what happened a week ago.
For the last seven trading sessions, the closing high has been 1,185.64 and the closing low has been 1,182.45. Kinda narrow. Today we’ve been as high as 1192. Our Buy List is currently up 0.85% today compared with 0.67% for the S&P 500.
Of course, the big news today is the election. If the polling is to be believed, the Democrats are in for a major defeat. Intrade currently sees the GOP gaining over 60 seats in the House.
I should caution you from reading too much into the market from politics. I’ve called this the “Larry Kudlow Syndrome” where every uptick or downtick in the market is due to something in Washington.
I’m reminded of the story when Richard Nixon was asked what he’d be doing if he weren’t president. Nixon said that he’d probably be down on Wall Street buying stocks. They asked an old-time Wall Streeter what he thought of that. He said that if Nixon weren’t president, he, too, would be buying stocks.
The Federal Reserve also begins its two-day meeting today in Washington. The big news will come tomorrow at 2:15 pm when they will announce their Quantitative Easing plan. As I said before, I expect everyone else to be disappointed so don’t be surprised to see a minor pullback.
Then on Thursday, we’ll have three more earnings reports. If that isn’t enough excitement, on Friday we’ll have the jobs report. After that, however, most of November ought to be pretty dull.
-
Morning News: November 2, 2010
Posted by Eddy Elfenbein on November 2nd, 2010 at 7:28 amRate Futures Report: Some Doubt About QE2 Before FOMC Meeting
Australia, India Raise Rates to Slow Inflation Before Fed Move
Oil Rises a Second Day on U.S. Stimulus Bets, Falling Fuel Supply Forecast
China Yuan Up On Weak Dollar Ahead of Fed Meeting
Why the Economy’s Growth Isn’t Easing Unemployment
GM to Sell over $13 Billion of Shares
BP Profit Down on Oil Spill Charges
BBVA to Buy Stake in Turkey’s Garanti Bank for $5.8 Billion
Gold Miner Newmont’s Third-quarter Profit Soars
-
Sysco Moves in the Right Direction
Posted by Eddy Elfenbein on November 1st, 2010 at 2:59 pmMichelle Leder spotted some more responsible behavior from Sysco (SYY). The company will no longer foot the bill when an senior exec takes a loss on a house. Michelle is careful to note that her praise is muted but that the company is moving in the right direction.
Stay tuned for earnings on Thursday.
-
The Turn-of-the-Month Effect
Posted by Eddy Elfenbein on November 1st, 2010 at 2:39 pmI’m reposting this from February. I had done some research on the turn-of-the-month effect:
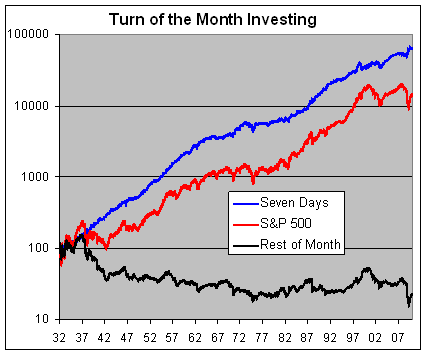
Since 1932, most of the S&P 500’s capital gain has come during a seven-day period at the turn of each month—specifically, the last four trading days and the first three trading days of each month. This represents about one-third of the total trading days. During the rest of the month, the stock market actually lost money.
Here are the numbers: Since the beginning of 1932, the S&P 500 has gained nearly 14,000% which is about 6.5% annualized. Investing in just the last four days and first three days of each month would have returned over 63,000% (not including trading costs). Annualized, that’s 8.6%. However, if you consider that it’s really only 32% of the time, the true annualized rate is over 28%.
The rest of the month — the other 68% of the time — has resulted in a combined loss of close to 78%.
Let me add some important caveats. First, I’m not offering this as trading advice. I’m merely showing that the market has historically experienced outsized gains at the turn of each month. Remember that trading in and out of the market is costly and these results don’t include taxes or commissions.
Secondly, this only refers to capital gains not dividends. A very large part of the market’s total return is due to dividends, and if you’re only invested one-third of the time, you’re going to lose out.
Having said that, here’s a graph showing what turn-of-the-month investing looks like. The S&P 500 is the red line. The blue line is performance during the seven-day period and the rest of the month is the black line.
Here’s a look at the average daily gains.Day Daily Gain Stand Dev Fourth to Last 0.068% 1.064% Third to Last 0.021% 1.055% Second to Last 0.071% 1.037% Last 0.088% 0.997% First 0.118% 1.117% Second 0.168% 1.065% Third 0.155% 1.077% Why has the market shown this performance? It’s hard to say. One idea is that we’re seeing a pattern that’s simply the result of random behavior. If you splice and dice any data long enough, you’re bound to find some anomaly.
My hunch, however, is that there’s something to the turn-of-the-month effect. Perhaps it’s new money coming in or maybe positive business news is more likely to be announced.
Still, as powerful as the historical data is, I think the effect is too transient to base any investment strategy on.
-
Dollar/Yen Hits Reality, 15-Year Low
Posted by Eddy Elfenbein on November 1st, 2010 at 1:52 pmThe dollar is being battered by the yen.
The dollar fell to a fresh 15-year-low against the yen early Monday before investors backed off, reluctant to risk the possibility of another strong Japanese intervention.
The pair fell to Y80.21, its lowest in 15 years and the closest it has come to the Y79.75 level that has stood since April 1995 as the dollar’s lowest point since the end of World War II.

-
Noonish Market Update
Posted by Eddy Elfenbein on November 1st, 2010 at 12:46 pmIt’s Monday and it’s another rally we’re having trouble holding onto. The ISM report is helping the market. The S&P 500 got as high as 1195.81 which is just shy of last Monday’s high of 1196.13.
As of right now, the Buy List is up 0.30% compared with 0.44% for the S&P 500. Intel (INTC) is doing particularly well with shares up over 2% on news of a pickup in chip sales.
Sysco (SYY) is closing in on $30 just ahead of its earnings report. This tends to be a very stable stock, but I think it could make a run over $30 very soon.
- Load More
Does anyone have a suit of armor, jet skis and a blowtorch I can borrow/rent? There's an experiment I'm working on.
This is pretty amazing. US elections combined since 1924:
GOP: 1,058,301,749
DEM: 1,057,846,951
Oth: 88,548,252Unemployment spikes in Washington, DC
-
-
Archives
- April 2025
- March 2025
- February 2025
- January 2025
- December 2024
- November 2024
- October 2024
- September 2024
- August 2024
- July 2024
- June 2024
- May 2024
- April 2024
- March 2024
- February 2024
- January 2024
- December 2023
- November 2023
- October 2023
- September 2023
- August 2023
- July 2023
- June 2023
- May 2023
- April 2023
- March 2023
- February 2023
- January 2023
- December 2022
- November 2022
- October 2022
- September 2022
- August 2022
- July 2022
- June 2022
- May 2022
- April 2022
- March 2022
- February 2022
- January 2022
- December 2021
- November 2021
- October 2021
- September 2021
- August 2021
- July 2021
- June 2021
- May 2021
- April 2021
- March 2021
- February 2021
- January 2021
- December 2020
- November 2020
- October 2020
- September 2020
- August 2020
- July 2020
- June 2020
- May 2020
- April 2020
- March 2020
- February 2020
- January 2020
- December 2019
- November 2019
- October 2019
- September 2019
- August 2019
- July 2019
- June 2019
- May 2019
- April 2019
- March 2019
- February 2019
- January 2019
- December 2018
- November 2018
- October 2018
- September 2018
- August 2018
- July 2018
- June 2018
- May 2018
- April 2018
- March 2018
- February 2018
- January 2018
- December 2017
- November 2017
- October 2017
- September 2017
- August 2017
- July 2017
- June 2017
- May 2017
- April 2017
- March 2017
- February 2017
- January 2017
- December 2016
- November 2016
- October 2016
- September 2016
- August 2016
- July 2016
- June 2016
- May 2016
- April 2016
- March 2016
- February 2016
- January 2016
- December 2015
- November 2015
- October 2015
- September 2015
- August 2015
- July 2015
- June 2015
- May 2015
- April 2015
- March 2015
- February 2015
- January 2015
- December 2014
- November 2014
- October 2014
- September 2014
- August 2014
- July 2014
- June 2014
- May 2014
- April 2014
- March 2014
- February 2014
- January 2014
- December 2013
- November 2013
- October 2013
- September 2013
- August 2013
- July 2013
- June 2013
- May 2013
- April 2013
- March 2013
- February 2013
- January 2013
- December 2012
- November 2012
- October 2012
- September 2012
- August 2012
- July 2012
- June 2012
- May 2012
- April 2012
- March 2012
- February 2012
- January 2012
- December 2011
- November 2011
- October 2011
- September 2011
- August 2011
- July 2011
- June 2011
- May 2011
- April 2011
- March 2011
- February 2011
- January 2011
- December 2010
- November 2010
- October 2010
- September 2010
- August 2010
- July 2010
- June 2010
- May 2010
- April 2010
- March 2010
- February 2010
- January 2010
- December 2009
- November 2009
- October 2009
- September 2009
- August 2009
- July 2009
- June 2009
- May 2009
- April 2009
- March 2009
- February 2009
- January 2009
- December 2008
- November 2008
- October 2008
- September 2008
- August 2008
- July 2008
- June 2008
- May 2008
- April 2008
- March 2008
- February 2008
- January 2008
- December 2007
- November 2007
- October 2007
- September 2007
- August 2007
- July 2007
- June 2007
- May 2007
- April 2007
- March 2007
- February 2007
- January 2007
- December 2006
- November 2006
- October 2006
- September 2006
- August 2006
- July 2006
- June 2006
- May 2006
- April 2006
- March 2006
- February 2006
- January 2006
- December 2005
- November 2005
- October 2005
- September 2005
- August 2005
- July 2005
 Eddy Elfenbein is a Washington, DC-based speaker, portfolio manager and editor of the blog Crossing Wall Street. His