-
Morning News: September 23, 2010
Posted by Eddy Elfenbein on September 23rd, 2010 at 8:38 amThe Fed, Translated Into English
Amid Tension, China Blocks Vital Exports to Japan
Central Banks Struggle for Exit as Recovery Weakens
Blockbuster to Slash Debt by $900 Million via Bankruptcy
Dollar Recoups Losses; Euro Pulls Back
Buyers Send iPhones on a Long Relay to China
Warren Buffett to CNBC: “We’re Still In a Recession”
Bill Gates Tops Forbes 400 Ranking of Richest Americans With $54 Billion
Here’s the Cookie Monster dressed as Issac Hayes singing the theme from Shaft and eating the set. Also, it’s in Dutch. After that, it gets a little strange. -
Bed Bath & Beyond’s Earnings: I Freakin Called It
Posted by Eddy Elfenbein on September 22nd, 2010 at 4:16 pmI wouldn’t be surprised to see BBBY smash earnings next week. The stock could even make as much as 70 cents per share (look at me being all bold).
Bed Bath & Beyond Inc. today reported net earnings of $.70 per diluted share ($181.8 million) in the fiscal second quarter ended August 28, 2010, an increase of approximately 35% versus net earnings of $.52 per diluted share ($135.5 million) in the same quarter a year ago.
That wasn’t a small beat either. Wall Street was expecting 63 cents per share.
Net sales for the fiscal second quarter of 2010 were approximately $2.137 billion, an increase of approximately 11.6% from net sales of approximately $1.915 billion reported in the fiscal second quarter of 2009. Comparable store sales in the fiscal second quarter of 2010 increased by approximately 7.4%, compared with a decrease of approximately 0.6% in last year’s fiscal second quarter.
Also during the fiscal second quarter of 2010, the Company repurchased approximately $193 million of its common stock representing approximately 4.9 million shares.
For the fiscal first half ended August 28, 2010, the Company reported net earnings of $1.22 per diluted share ($319.3 million), an increase of approximately 42% over net earnings of $.86 per diluted share ($222.7 million) in the corresponding period a year ago. Net sales for the fiscal first half of 2010 were approximately $4.060 billion, an increase of approximately 12.5% from net sales of approximately $3.609 billion in the corresponding period a year ago. Comparable store sales for the fiscal first half of 2010 increased by approximately 7.9%, compared with a decrease of approximately 1.1% in last year’s fiscal first half.
For the fiscal third quarter of 2010, the Company is modeling net earnings per diluted share to be approximately $.61 to $.65. For fiscal 2010, the Company is now modeling net earnings per diluted share to increase by approximately 20%, up from the previous model of approximately 15%.That last line is great news. BBBY made $2.30 per share last year so the company is effectively increasing its EPS projection from $2.64 to $2.76. The Street was at $2.71.
Here are the earnings results going back a few years:Quarter Sales Gross Profit Operating Profit Net Profit EPS $146,214 $28,015 $17,883 $0.06 $451,715 $185,570 $53,580 $33,247 $0.12 $480,145 $196,784 $50,607 $31,707 $0.11 $569,012 $238,233 $77,138 $48,392 $0.17 $459,163 $187,293 $36,339 $23,364 $0.08 $589,381 $241,284 $70,009 $43,578 $0.15 $602,004 $246,080 $64,592 $40,665 $0.14 $746,107 $311,802 $101,898 $64,315 $0.22 $575,833 $234,959 $45,602 $30,007 $0.10 $713,636 $291,342 $84,672 $53,954 $0.18 $759,438 $311,030 $83,749 $52,964 $0.18 $879,055 $370,235 $132,077 $82,674 $0.28 $776,798 $318,362 $72,701 $46,299 $0.15 $903,044 $370,335 $119,687 $75,459 $0.25 $936,030 $386,224 $119,228 $75,112 $0.25 $1,049,292 $443,626 $168,441 $105,309 $0.35 $893,868 $367,180 $90,450 $57,508 $0.19 $1,111,445 $459,145 $155,867 $97,208 $0.32 $1,174,740 $486,987 $161,459 $100,506 $0.33 $1,297,928 $563,352 $231,567 $144,248 $0.47 $1,100,917 $456,774 $128,707 $82,049 $0.27 $1,273,960 $530,829 $189,108 $120,008 $0.39 $1,305,155 $548,152 $190,978 $121,927 $0.40 $1,467,646 $650,546 $283,621 $180,980 $0.59 $1,244,421 $520,781 $150,884 $98,903 $0.33 $1,431,182 $601,784 $217,877 $141,402 $0.47 $1,448,680 $615,363 $205,493 $134,620 $0.45 $1,685,279 $747,820 $304,917 $197,922 $0.67 $1,395,963 $590,098 $148,750 $100,431 $0.35 $1,607,239 $678,249 $219,622 $145,535 $0.51 $1,619,240 $704,073 $211,134 $142,436 $0.50 $1,994,987 $862,982 $309,895 $205,842 $0.72 $1,553,293 $646,109 $154,391 $104,647 $0.38 $1,767,716 $732,158 $211,037 $147,008 $0.55 $1,794,747 $747,866 $203,152 $138,232 $0.52 $1,933,186 $799,098 $259,442 $172,921 $0.66 $1,648,491 $656,000 $118,819 $76,777 $0.30 $1,853,892 $739,321 $187,421 $119,268 $0.46 $1,782,683 $692,857 $136,374 $87,700 $0.34 $1,923,274 $785,058 $231,282 $141,378 $0.55 $1,694,340 $666,818 $142,304 $87,172 $0.34 $1,914,909 $773,393 $222,031 $135,531 $0.52 $1,975,465 $812,412 $245,611 $151,288 $0.58 $2,244,079 $955,496 $370,741 $226,042 $0.86 $1,923,051 $775,036 $225,394 $137,553 $0.52 $2,136,730 $874,918 $296,902 $181,755 $0.70 Here’s a closer look at the critical factor, the rebound in BBBY’s margins.

For financial newbies, net margin is a fancy way of saying the “bottom line.” Operating margin is just like net margin but it doesn’t include interest expense or taxes. What’s interesting is that BBBY is able to charge more for its products while sales are still growing at a healthy pace. Net sales have grown by double-digits for the last four quarters in a row.
I said last week that I would be leery of starting a position over $40. I still feel that way but the new guidance makes me willing to go as high as $42. The shares are up after hours. If you’re looking to buy BBBY, don’t it chase it — wait for it to come to you. -
CNBC Debuts!
Posted by Eddy Elfenbein on September 21st, 2010 at 10:14 amFrom 1989:
-
The Trading Range is Finally Broken
Posted by Eddy Elfenbein on September 21st, 2010 at 10:05 amWe finally did it yesterday. The S&P 500 had closed between 1022.58 and 1127.79 for 86 straight days.
Thanks to a surge yesterday, the market not only broke though 1130 but finished at 1142.71.
I can’t tell if this bodes well for the market, but I do believe that the market continues to be underpriced, particularly the stock on our Buy List. AFLAC (AFL) broke through $53 per share. Reynolds American (RAI) is getting very close to $60 per share. (I thought dividend stocks were supposed to be boring!)
Although it’s not on the Buy List, I noticed that ConAgra (CAG) just upped its dividend by 15%. The quarterly dividend is now 23 cents per share which is up from 20 cents per share. The stock now yields 4.3% which is about 45 bips above the 30-year Treasury.
-
Morning News: September 21, 2010
Posted by Eddy Elfenbein on September 21st, 2010 at 9:31 amWorst Over in Global Poll Pointing to Reduced Market Returns
Airline Profits Expected to Soar This Year
SAIC of China Weighs Buying Stake in G.M.
Irish, Spanish, Greek Auctions Calm Investor Nerves
H.P. Settles Lawsuit Against Hurd
President Obama Defends Actions on Economy
Corporate Political Giving Swings Toward the GOP
Generation Y Giving Cars a Pass -
Charlie Munger at the University of Michigan
Posted by Eddy Elfenbein on September 20th, 2010 at 2:09 pmEver wonder why Warren and not Charlie is the public face of Berkshire?
Charles Munger, the billionaire vice chairman of Berkshire Hathaway Inc., defended the U.S. financial-company rescues of 2008 and told students that people in economic distress should “suck it in and cope.”
“You should thank God” for bank bailouts, Munger said in a discussion at the University of Michigan on Sept. 14, according to a video posted on the Internet. “Now, if you talk about bailouts for everybody else, there comes a place where if you just start bailing out all the individuals instead of telling them to adapt, the culture dies.”
Bank rescues allowed the U.S. to avoid what could have been an “awful” downturn and will help the country as it deals with the housing slump, Munger, 86, said. He used the example of post-World War I Germany to explain how the bailouts under Presidents George W. Bush and Barack Obama were “absolutely required to save your civilization.”
“Hit the economy with enough misery and enough disruption, destroy the currency, and God knows what happens,” Munger said. “So I think when you have troubles like that you shouldn’t be bitching about a little bailout. You should have been thinking it should have been bigger.”
Germany was unable to stabilize its financial system in the 1920s, and, Munger said, “We ended up with Adolf Hitler.” -
AFLAC Upgrade
Posted by Eddy Elfenbein on September 20th, 2010 at 1:16 pmBarron’s has Sandler O’Neil’s upgrade of AFLAC (AFL):
We are upgrading shares of Aflac to Buy from Hold and are increasing our price target to $63 from $54 following a recent analyst day in Tokyo.
We believe that sales of third-sector supplemental-type insurance products will continue to have growth in Japan given the country’s aging population, increasing out-of-pocket medical expenses for consumers, and a government cancer-awareness initiative.
Aflac’s sales through the bank channel will continue to increase over time, and Aflac has more bank distribution relationships than any of its competitors. The bank channel will account for an increasing proportion of Aflac’s sales.
Aflac’s new product sales appear to have continued their upward trajectory, although year-over-year comparisons will be challenging due to significant sales growth in second-half 2009. The child-endowment product will continue to have strong sales, and we expect cancer products will begin to reverse recent declines in sales.
The margins for the child endowment product are a little better than we had thought — management stated margins are about 5% and are similar to medical products.
We are adjusting our 2010 operating earnings-per-share estimate to $5.45 up from $5.44 to account for incremental strength in the Japan operations. We are also increasing our 2011 EPS estimate to $6.00 from $5.95 to account for stronger results in the Japan segment. Consensus EPS estimates are currently $5.46 and $5.99 for 2010 and 2011, respectively.
The stock broke $53 this morning.
-
Momentum: Not Monthly, but Daily
Posted by Eddy Elfenbein on September 20th, 2010 at 1:08 pmAndrew Haldane of the Bank of England recently had a remarkable chart showing the success of momentum investing. Being in the market the month following an “up” month has historically creamed a buy-and-hold strategy.
The problem is that the data was wrong. Well, not wrong exactly but it was the wrong data. Haldane was using a monthly average for the index instead of the close. When you use the close, the chart looks very different.
Still, historically there’s been a very strong momentum effect. Instead of looking at monthly totals, I once looked at daily changes. The stock market has done very well on days following “up” days, and it’s done poorly on days following “down” days.
I found that the market’s entire capital gain has come on days following +0.64% or more gains. That’s only about 20% of the time. The other 80% of the time, the market is net flat. “Half the market’s gain came on day’s following 3.2% up moves. On average, that happens slightly less than once a year.”
While this strategy has been very successful historically, the impact has faded greatly over the past 15 to 20 years. -
Gold Adjusted for Inflation
Posted by Eddy Elfenbein on September 20th, 2010 at 12:19 pmDespite the rally, gold is still well below its value from 30 years ago.
Gold is still far below its inflation-adjusted high after a record rally, and at least one indicator suggests the precious metal won’t approach that peak any time soon.
The CHART OF THE DAY shows the gold price relative to January 1980, when the metal reached $873 an ounce. Yesterday’s record close in New York trading equals $454.88 an ounce in real terms, reflecting an increase in the U.S. consumer price index, according to data compiled by Bloomberg.
Gold would have to rise above $2,435 an ounce to exceed its high from three decades ago, based on the CPI’s current reading. That’s 91 percent higher than the closing price of $1,272.20 in New York trading yesterday. -
The ISM Told Us
Posted by Eddy Elfenbein on September 20th, 2010 at 11:54 amI’ve often said that the monthly ISM index has been a pretty reliable indicator of when NBER dates recessions. This time around, the ISM was slow in telling us when the recession started but was pretty good on getting the end.
The subject of recession dating is quite literally academic — it depends on what you call a recession. Here’s NBER’s official statement on how it pinpoints a peak and trough in the economic cycle.
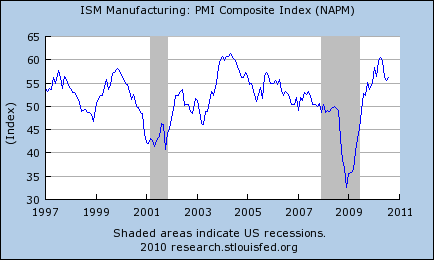
I’ve found that the tipping point on the ISM index is about 44.4. According to NBER, the recession began in December 2007 when the ISM was still around 50. It danced around 50 until the financial crisis of that September.
The ISM jumped from 43.2 in May 2009 to 45.3 in June to 49.1 in July. The index has been above 50 every month since August 2009.
- Tweets by @EddyElfenbein
-
-
Archives
- September 2024
- August 2024
- July 2024
- June 2024
- May 2024
- April 2024
- March 2024
- February 2024
- January 2024
- December 2023
- November 2023
- October 2023
- September 2023
- August 2023
- July 2023
- June 2023
- May 2023
- April 2023
- March 2023
- February 2023
- January 2023
- December 2022
- November 2022
- October 2022
- September 2022
- August 2022
- July 2022
- June 2022
- May 2022
- April 2022
- March 2022
- February 2022
- January 2022
- December 2021
- November 2021
- October 2021
- September 2021
- August 2021
- July 2021
- June 2021
- May 2021
- April 2021
- March 2021
- February 2021
- January 2021
- December 2020
- November 2020
- October 2020
- September 2020
- August 2020
- July 2020
- June 2020
- May 2020
- April 2020
- March 2020
- February 2020
- January 2020
- December 2019
- November 2019
- October 2019
- September 2019
- August 2019
- July 2019
- June 2019
- May 2019
- April 2019
- March 2019
- February 2019
- January 2019
- December 2018
- November 2018
- October 2018
- September 2018
- August 2018
- July 2018
- June 2018
- May 2018
- April 2018
- March 2018
- February 2018
- January 2018
- December 2017
- November 2017
- October 2017
- September 2017
- August 2017
- July 2017
- June 2017
- May 2017
- April 2017
- March 2017
- February 2017
- January 2017
- December 2016
- November 2016
- October 2016
- September 2016
- August 2016
- July 2016
- June 2016
- May 2016
- April 2016
- March 2016
- February 2016
- January 2016
- December 2015
- November 2015
- October 2015
- September 2015
- August 2015
- July 2015
- June 2015
- May 2015
- April 2015
- March 2015
- February 2015
- January 2015
- December 2014
- November 2014
- October 2014
- September 2014
- August 2014
- July 2014
- June 2014
- May 2014
- April 2014
- March 2014
- February 2014
- January 2014
- December 2013
- November 2013
- October 2013
- September 2013
- August 2013
- July 2013
- June 2013
- May 2013
- April 2013
- March 2013
- February 2013
- January 2013
- December 2012
- November 2012
- October 2012
- September 2012
- August 2012
- July 2012
- June 2012
- May 2012
- April 2012
- March 2012
- February 2012
- January 2012
- December 2011
- November 2011
- October 2011
- September 2011
- August 2011
- July 2011
- June 2011
- May 2011
- April 2011
- March 2011
- February 2011
- January 2011
- December 2010
- November 2010
- October 2010
- September 2010
- August 2010
- July 2010
- June 2010
- May 2010
- April 2010
- March 2010
- February 2010
- January 2010
- December 2009
- November 2009
- October 2009
- September 2009
- August 2009
- July 2009
- June 2009
- May 2009
- April 2009
- March 2009
- February 2009
- January 2009
- December 2008
- November 2008
- October 2008
- September 2008
- August 2008
- July 2008
- June 2008
- May 2008
- April 2008
- March 2008
- February 2008
- January 2008
- December 2007
- November 2007
- October 2007
- September 2007
- August 2007
- July 2007
- June 2007
- May 2007
- April 2007
- March 2007
- February 2007
- January 2007
- December 2006
- November 2006
- October 2006
- September 2006
- August 2006
- July 2006
- June 2006
- May 2006
- April 2006
- March 2006
- February 2006
- January 2006
- December 2005
- November 2005
- October 2005
- September 2005
- August 2005
- July 2005
 Eddy Elfenbein is a Washington, DC-based speaker, portfolio manager and editor of the blog Crossing Wall Street. His