-
Momentum: Not Monthly, but Daily
Posted by Eddy Elfenbein on September 20th, 2010 at 1:08 pmAndrew Haldane of the Bank of England recently had a remarkable chart showing the success of momentum investing. Being in the market the month following an “up” month has historically creamed a buy-and-hold strategy.
The problem is that the data was wrong. Well, not wrong exactly but it was the wrong data. Haldane was using a monthly average for the index instead of the close. When you use the close, the chart looks very different.
Still, historically there’s been a very strong momentum effect. Instead of looking at monthly totals, I once looked at daily changes. The stock market has done very well on days following “up” days, and it’s done poorly on days following “down” days.
I found that the market’s entire capital gain has come on days following +0.64% or more gains. That’s only about 20% of the time. The other 80% of the time, the market is net flat. “Half the market’s gain came on day’s following 3.2% up moves. On average, that happens slightly less than once a year.”
While this strategy has been very successful historically, the impact has faded greatly over the past 15 to 20 years. -
Gold Adjusted for Inflation
Posted by Eddy Elfenbein on September 20th, 2010 at 12:19 pmDespite the rally, gold is still well below its value from 30 years ago.
Gold is still far below its inflation-adjusted high after a record rally, and at least one indicator suggests the precious metal won’t approach that peak any time soon.
The CHART OF THE DAY shows the gold price relative to January 1980, when the metal reached $873 an ounce. Yesterday’s record close in New York trading equals $454.88 an ounce in real terms, reflecting an increase in the U.S. consumer price index, according to data compiled by Bloomberg.
Gold would have to rise above $2,435 an ounce to exceed its high from three decades ago, based on the CPI’s current reading. That’s 91 percent higher than the closing price of $1,272.20 in New York trading yesterday. -
The ISM Told Us
Posted by Eddy Elfenbein on September 20th, 2010 at 11:54 amI’ve often said that the monthly ISM index has been a pretty reliable indicator of when NBER dates recessions. This time around, the ISM was slow in telling us when the recession started but was pretty good on getting the end.
The subject of recession dating is quite literally academic — it depends on what you call a recession. Here’s NBER’s official statement on how it pinpoints a peak and trough in the economic cycle.
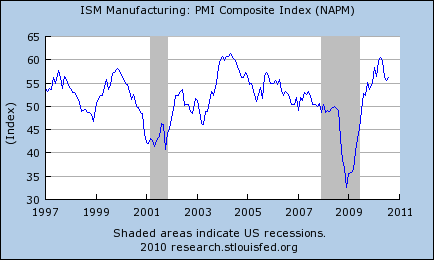
I’ve found that the tipping point on the ISM index is about 44.4. According to NBER, the recession began in December 2007 when the ISM was still around 50. It danced around 50 until the financial crisis of that September.
The ISM jumped from 43.2 in May 2009 to 45.3 in June to 49.1 in July. The index has been above 50 every month since August 2009.
-
Time Machine
Posted by Eddy Elfenbein on September 20th, 2010 at 11:13 amNow that an independent body has declared the recession over, let’s take a look at some of the more wrong-headed forecasts:
From March 6, 2009:
Roubini Says Recession May Continue Until End of 2010
Or the absurd fight between Dennis Kneale and bloggers. The fight quickly turned into exactly what Kneale wanted — a publicity stunt — but it originally began when Kneale said the recession had just ended.
-
Recession Over! (Technically)
Posted by Eddy Elfenbein on September 20th, 2010 at 10:28 amIt’s official, the recession ended in June 2009 according to the National Bureau of Economic Research:
The Business Cycle Dating Committee of the National Bureau of Economic Research met yesterday by conference call. At its meeting, the committee determined that a trough in business activity occurred in the U.S. economy in June 2009. The trough marks the end of the recession that began in December 2007 and the beginning of an expansion. The recession lasted 18 months, which makes it the longest of any recession since World War II. Previously the longest postwar recessions were those of 1973-75 and 1981-82, both of which lasted 16 months.
In determining that a trough occurred in June 2009, the committee did not conclude that economic conditions since that month have been favorable or that the economy has returned to operating at normal capacity. Rather, the committee determined only that the recession ended and a recovery began in that month. A recession is a period of falling economic activity spread across the economy, lasting more than a few months, normally visible in real GDP, real income, employment, industrial production, and wholesale-retail sales. The trough marks the end of the declining phase and the start of the rising phase of the business cycle. Economic activity is typically below normal in the early stages of an expansion, and it sometimes remains so well into the expansion.
The committee decided that any future downturn of the economy would be a new recession and not a continuation of the recession that began in December 2007. The basis for this decision was the length and strength of the recovery to date. -
Another Up Monday
Posted by Eddy Elfenbein on September 20th, 2010 at 10:02 amHappiness reigns again on Wall Street, at least for now. The averages are modestly higher although we’re still below the Iron Curtain of 1130. I’m not a big fan of technical analysis but I do concede that markets often seem to act with undue deference towards “resistance points.” That’s happening again as the S&P 500 has tried and repeatedly failed to stay over 1130 for very long. But if this is going to be our fourth straight week of gains, then we’re off to a good start.
The big news this week will be tomorrow’s Fed meeting. I don’t expect any change in rates—meaning, if we had something like interest rates. However, I’ll be curious if there’s any real change in the Fed’s policy statement.
The other news item that I’ll be watching closely is the earnings report from Bed Bath & Beyond (BBBY). This is due to come on Wednesday. Here’s my latest take on BBBY’s earnings report.
Finally, here’s a look at the S&P 500 along with the earnings:
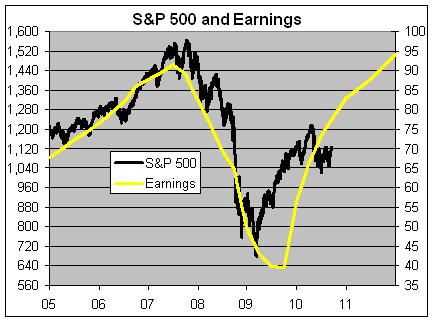
The implication is that the market is cheap IF the earnings scenario holds. The future earnings projections isn’t from me — that’s Wall Street’s consensus via S&P. -
Morning News: September 20, 2010
Posted by Eddy Elfenbein on September 20th, 2010 at 9:42 amEgged on by Hedge Funds, Oliver Stone Turns on Goldman Sachs
Wall Street’s Profit Engines Slow Down
Nissan to Double China Capacity
Bond Markets Get Riskier
Verizon Names President, COO
Lennar Reports Profit as Cost Cuts Contribute to Wider Home-Sale Margins
OIL FUTURES: Crude Nudges Higher, But Volumes Are Thin
Pocket money ‘Cut for Youngsters’ -
Oracle Hits Nine-Year High
Posted by Eddy Elfenbein on September 17th, 2010 at 2:21 pmWow, Mark Hurd hasn’t been on the job very long and Oracle (ORCL) is already doing well. The company just reported very strong results. The stock is now over $27 which is a nine-year high.
Oracle reported a net income of $1.35 billion, or 27 cents a share, compared with a profit of $1.12 billion, or 22 cents a share, for the year-earlier period. Revenue rose 48% to 7.5 billion. Adjusted income was 42 cents a share.
Analysts had expected the company to report adjusted earnings of 36 cents a share on revenue of $7.3 billion, according to a consensus survey by FactSet Research.
Oracle has been widely expected to benefit from rising corporate spending on information technology. But Oracle Co-President Safra Catz said in a call with analysts that “what’s really going on is we have a lot of company-specific momentum in each line of business.”The stock is up 11% since Hurd came on board 11 days ago.
-
Morning News: September 17, 2010
Posted by Eddy Elfenbein on September 17th, 2010 at 9:02 amLondon Hotel Revenue Returns to 2008 Level on Business Travel
US STOCKS-Futures Rise After Strong Tech Earnings
Cheapest Stocks Fail to Lure Investors as Bullish Signs Mount
U.S. to Sell G.M. Stake Over Time
Johnson & Johnson Aims to Buy Vaccine Maker Crucell
Senate Approves Small Business Bill
Apple Said to Negotiate With Publishers Over Digital Newsstand
FedEx Delivers Int’l Profits but Cuts US Jobs -
Department of No Duh!
Posted by Eddy Elfenbein on September 16th, 2010 at 2:06 pmYoung, male, testosterone-fuelled CEOs more likely to start or drop deals: UBC study
Too much testosterone can be a deal breaker, according to Sauder School of Business researchers at the University of British Columbia. Their paper, to be published in the INFORMS journal Management Science on September 10, shows that young CEOs with more of the steroidal hormone in their system are more likely to initiate, scrap or resist mergers and acquisitions.
The study by Sauder Finance Professors Maurice Levi and Kai Li, and PhD student Feng Zhang, titled “Deal or No Deal: Hormones and the Mergers and Acquisitions Game,” shows that testosterone – a hormone associated with male dominance-seeking in competitive situations – can be a negative factor in high-stakes decision-making.
“We find a strong association between male CEOs being young and their withdrawal rate of initiated mergers and acquisition,” says Prof. Levi, whose research relies on the established correlation between relative youth and increased levels of testosterone.(HT: Dealbreaker)
- Tweets by @EddyElfenbein
-
-
Archives
- September 2024
- August 2024
- July 2024
- June 2024
- May 2024
- April 2024
- March 2024
- February 2024
- January 2024
- December 2023
- November 2023
- October 2023
- September 2023
- August 2023
- July 2023
- June 2023
- May 2023
- April 2023
- March 2023
- February 2023
- January 2023
- December 2022
- November 2022
- October 2022
- September 2022
- August 2022
- July 2022
- June 2022
- May 2022
- April 2022
- March 2022
- February 2022
- January 2022
- December 2021
- November 2021
- October 2021
- September 2021
- August 2021
- July 2021
- June 2021
- May 2021
- April 2021
- March 2021
- February 2021
- January 2021
- December 2020
- November 2020
- October 2020
- September 2020
- August 2020
- July 2020
- June 2020
- May 2020
- April 2020
- March 2020
- February 2020
- January 2020
- December 2019
- November 2019
- October 2019
- September 2019
- August 2019
- July 2019
- June 2019
- May 2019
- April 2019
- March 2019
- February 2019
- January 2019
- December 2018
- November 2018
- October 2018
- September 2018
- August 2018
- July 2018
- June 2018
- May 2018
- April 2018
- March 2018
- February 2018
- January 2018
- December 2017
- November 2017
- October 2017
- September 2017
- August 2017
- July 2017
- June 2017
- May 2017
- April 2017
- March 2017
- February 2017
- January 2017
- December 2016
- November 2016
- October 2016
- September 2016
- August 2016
- July 2016
- June 2016
- May 2016
- April 2016
- March 2016
- February 2016
- January 2016
- December 2015
- November 2015
- October 2015
- September 2015
- August 2015
- July 2015
- June 2015
- May 2015
- April 2015
- March 2015
- February 2015
- January 2015
- December 2014
- November 2014
- October 2014
- September 2014
- August 2014
- July 2014
- June 2014
- May 2014
- April 2014
- March 2014
- February 2014
- January 2014
- December 2013
- November 2013
- October 2013
- September 2013
- August 2013
- July 2013
- June 2013
- May 2013
- April 2013
- March 2013
- February 2013
- January 2013
- December 2012
- November 2012
- October 2012
- September 2012
- August 2012
- July 2012
- June 2012
- May 2012
- April 2012
- March 2012
- February 2012
- January 2012
- December 2011
- November 2011
- October 2011
- September 2011
- August 2011
- July 2011
- June 2011
- May 2011
- April 2011
- March 2011
- February 2011
- January 2011
- December 2010
- November 2010
- October 2010
- September 2010
- August 2010
- July 2010
- June 2010
- May 2010
- April 2010
- March 2010
- February 2010
- January 2010
- December 2009
- November 2009
- October 2009
- September 2009
- August 2009
- July 2009
- June 2009
- May 2009
- April 2009
- March 2009
- February 2009
- January 2009
- December 2008
- November 2008
- October 2008
- September 2008
- August 2008
- July 2008
- June 2008
- May 2008
- April 2008
- March 2008
- February 2008
- January 2008
- December 2007
- November 2007
- October 2007
- September 2007
- August 2007
- July 2007
- June 2007
- May 2007
- April 2007
- March 2007
- February 2007
- January 2007
- December 2006
- November 2006
- October 2006
- September 2006
- August 2006
- July 2006
- June 2006
- May 2006
- April 2006
- March 2006
- February 2006
- January 2006
- December 2005
- November 2005
- October 2005
- September 2005
- August 2005
- July 2005
 Eddy Elfenbein is a Washington, DC-based speaker, portfolio manager and editor of the blog Crossing Wall Street. His