-
The CWS Buy List YTD
Posted by Eddy Elfenbein on September 3rd, 2010 at 10:44 amThanks to this morning’s push, the Crossing Wall Street Buy List has crept back into the black for the year.
Through yesterday’s close, we were down -0.79% for the year compared with -2.24% for the S&P 500. That doesn’t include dividends.
Here’s a look at the chart:

By early April, we ran to a big lead of more than 600 basis points. Since then, our lead has steadily eroded but we’re still ahead of the market. -
The Good News Is that the Bad News Wasn’t as Bad as Expected!
Posted by Eddy Elfenbein on September 3rd, 2010 at 9:46 amToday’s jobs report is being celebrated as “better-than-expected” which probably comes as a surprise to most non-Wall Streeters. After all, the unemployment rate ticked up from 9.5% in July to 9.6% for August, and there are now close to 15 million unemployed people in the country. That also doesn’t count the people who have left the job market entirely.
The “good” part of the news is that the private sector added 107,000 jobs in August while Wall Street was expecting just 40,000. Overall employment fell by 54,000 which was the same amount lost during July.Employment at service-providers decreased 54,000. Construction companies added 19,000 workers, the first gain in four months, and retailers cut 4,900 workers.
Average hourly earnings rose 0.3 percent to $22.66 from $22.60 in the prior month, today’s report showed.
Government payrolls decreased by 121,000. State and local governments reduced employment by 10,000, while the federal government lost 111,000 jobs.
The average work week for all workers held at 34.2 hours.As I mentioned, the overall unemployment rate rose from 9.5% to 9.6%, if we break down the decimals, it really rose from 9.51% to 9.64%. Only 12,000 more job losses and the number would round up to 9.7%.
One of the bright spots is that the civilian labor force increased by 550,000. This means that more people are looking for work. All I can say is that it could have been worse. -
$4 Trillion a Day
Posted by Eddy Elfenbein on September 2nd, 2010 at 2:28 pm
Guess what market has daily volume of $4 trillion?
Give up? I’ll give you a hint: The currency markets.
Look at the table on the link. What’s interesting is how much the U.S. dollar dominates the currency markets. In fact, if you were to place a non-dollar trade — say, British pounds to Mexican peso — it would probably go pounds to dollars and then dollars to pesos. -
ISM Chart
Posted by Eddy Elfenbein on September 2nd, 2010 at 9:56 amHere’s the latest chart on the Institute for Supply Management index:
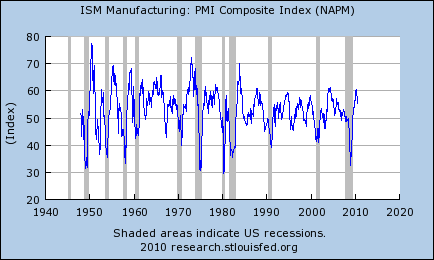
As I’ve discussed before, this is one of the best metrics for telling us if we’re in a recession or not. Notice how often the recession bars on the chart coincide with low ISMs.
A reading above 50 means the economy is expanding, below 50 means we’re contracting. Yesterday’s reading was 56.3.
Until now, I’ve been a doubter on the Double-Dip hypothesis, but now I think I need to take that scenario a lot more seriously. I still don’t think a second recession is probable, but the odds of one have increased markedly.
Fortunately, the ISM takes some of the worry off. The jobs outlook, however, does not. Despite all the concerns of a Double Dip, the quarterly GDP growth number has dropped from 5% in Q4 to 3.7% in Q1 to 1.6% in Q2.
That’s not good, but it’s (for now) not a recession. I should add that we have been fooled before by a false Double Dip. Let’s take a look at what happened 19 years ago:
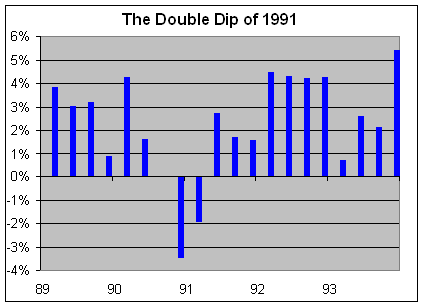
GDP growth was negative for three straights quarters (you can’t see Q3’90 of -0.006% but it’s there).Then the economy grew by 2.7% in the third quarter of 1991, followed by 1.7% in Q4 and 1.6% in Q1 of 1992. That’s successively lower growth just like we’re seeing now. Yet, it didn’t lead us to another recession. In fact, it led to four straight quarters of 4% of more growth.
Here’s an AP article from December 1991 titled “National economy stalled on brink of double-dip recession.” This came right as the time the double-dip threat was passing.
I’m not saying that history will repeat itself. I’m merely pointing that a double-dip is certainly possible, we still have a ways to go to get to one. -
A Look at the Mid-Term Rally
Posted by Eddy Elfenbein on September 1st, 2010 at 2:10 pmThe stock market has historically done very well from its low point during a mid-term election year to the high point during a presidential election year. Check out the numbers:
Mid-Term Low to Dow Jones Election-Year High Percent Gain 1934-36 116.20% 1938-40 54.40% 1942-44 64.20% 1946-48 18.40% 1950-52 48.40% 1954-56 86.20% 1958-60 56.90% 1962-64 66.40% 1966-68 32.40% 1970-72 64.20% 1974-76 75.70% 1978-80 34.80% 1982-84 65.60% 1986-88 45.30% 1990-92 44.30% 1994-96 82.60% 1998-00 55.50% 2002-04 49.00% 2006-08 22.40% 2010-12 (to come) Average: 57.00% (Data via Gary Alexander)
The Dow’s lowest close (so far) this year came on July 2 at 9,686.48. A 57% rally would bring the Dow to over 15,200. -
ISM 56.3
Posted by Eddy Elfenbein on September 1st, 2010 at 9:58 amWhew! The ISM number came in at 56.3 which was well above expectations of 53.
I feel like we dodged a bullet here. The market should continue to rally. -
ISM Due at 10 am
Posted by Eddy Elfenbein on September 1st, 2010 at 9:29 amStocks are rocking this morning, but the ISM comes out at 10 am. The Street expects 53. A negative surprise could be very nasty. I’m now hiding under my snuggie.
-
Good Earnings from Joe Bank
Posted by Eddy Elfenbein on September 1st, 2010 at 8:52 amJos. A. Bank Clothiers (JOSB) just released a very good Q2 earnings report this morning. The company earned 59 cents a share which was six cents more than Wall Street was expecting. Let’s hope the stock gets a nice bump today.
The details look very solid. Sales rose 12.3% and same-store sales rose 9.2%. A year ago, the company earned 45 cents a share. I’m especially glad to see that gross margins improved to 62.8% from 61.5%.
Right now, Wall Street pegs JOSB to earn $3 for the entire year, bear in mind that a very large part of that comes in their fourth quarter. I expect Wall Street to up its full-year estimates soon. Three months ago, JOSB beat the Street by 14 cents a share.
JOSB has posted higher year-over-year earnings for 35 of the last 36 quarters including the last 17 in a row. Even at $3 a share, the stock is going for about 12 times forward earnings which is a decent value.
Update: The stock is up 13% today. I’m now playing that Gary Glitter HEY song in my office. -
From 1985: What Will Shopping Be Like in 2010?
Posted by Eddy Elfenbein on August 31st, 2010 at 12:05 amFrom 1985, peer into the distant future of 2010.
-
The WSJ Takes on the P/E Ratio
Posted by Eddy Elfenbein on August 30th, 2010 at 2:43 pmThe Wall Street Journal has a rather unusual column today claiming that the Price/Earnings Ratio is not only declining, but the metric’s importance is declining as well. For supporting evidence, they offer up the fact that corporate earnings were strong this past earnings season but the stock market has since fallen.
Sorry folks but that’s not a hard knot to entangle: The P/E Ratio looks backward while stock prices look forward. As a result, you can get some poor readings. I’m afraid to tell the WSJ that despite this minor conflict, the P/E Ratio remains very important (though we must be aware of its shortcomings).
The WSJ goes on to say that the P/E Ratio has plunged about 36% in the past 12 months which is the biggest drop in seven years. Again, this shouldn’t be much of a surprise because, as I just mentioned, the P/E Ratio looks backward. Corporate earnings have improved very dramatically since the depths of the recession. A higher E with a flat-to-lower P means a lower P/E Ratio. Mystery solved.
The WSJ also writes that the forward P/E Ratio has dropped from 14.4 in May to 12.2 currently. This probably means that stock prices are ahead of analysts’ forecast and that those projections may be headed lower soon.
Because of the time discrepancy in the P/E Ratio we sometimes get “false readings.” For example, when stocks are cheapest, the earnings line is often still headed lower. As a result, the very first stages of a bull market often shows the P/E Ratio dramatically expanding. The opposite happens when the market begins to look rich, which may be happening right now. Stocks are sluggish while earnings have improved. As a result, you have stocks falling after good earnings combined with a subdued P/E Ratio.Three months ago, analysts expected the companies in the Standard & Poor’s 500-stock index to boost profits 18% in 2011. Now, they predict 15%. Mutual-fund, hedge-fund and other money managers put the increase at closer to 9%, according to a recent Citigroup survey, while Mr. Levkovich’s estimate is for 7% growth.
“The sustainability of earnings is in doubt,” said Howard Silverblatt, an index analyst at S&P in New York. “Estimates are still optimistic.”The WSJ says that the P/E Ratio is plagued by the lack of certainty in future earnings, and on this point I agree. Think of it this way. Imagine we have two stocks that are similar in every way except for one difference. Stock A is projected to earn $1 a share next year, plus or minus 20 cents. Stock B is projected to earn $1 a share next year, plus or minus three cents. Which stock will be worth more? Outside of rare exceptions, we can assume that Stock B will be worth more. Why? Because the market rewards certainty.
The WSJ also claims that the P/E Ratio has had earlier bouts of loss of importance — from the Great Depression to the early post-war period and again during the inflation struggles of the 1970s and early 80s. I agree on the former, but the latter was hardly a refutation of the P/E Ratio. It’s simply that the P/E is closely tied to interest rates. As rates head higher, P/E Ratios headed lower so stocks could actively compete with bonds.
I can assure you that any obituary for the P/E Ratio is very premature.
- Tweets by @EddyElfenbein
-
-
Archives
- September 2024
- August 2024
- July 2024
- June 2024
- May 2024
- April 2024
- March 2024
- February 2024
- January 2024
- December 2023
- November 2023
- October 2023
- September 2023
- August 2023
- July 2023
- June 2023
- May 2023
- April 2023
- March 2023
- February 2023
- January 2023
- December 2022
- November 2022
- October 2022
- September 2022
- August 2022
- July 2022
- June 2022
- May 2022
- April 2022
- March 2022
- February 2022
- January 2022
- December 2021
- November 2021
- October 2021
- September 2021
- August 2021
- July 2021
- June 2021
- May 2021
- April 2021
- March 2021
- February 2021
- January 2021
- December 2020
- November 2020
- October 2020
- September 2020
- August 2020
- July 2020
- June 2020
- May 2020
- April 2020
- March 2020
- February 2020
- January 2020
- December 2019
- November 2019
- October 2019
- September 2019
- August 2019
- July 2019
- June 2019
- May 2019
- April 2019
- March 2019
- February 2019
- January 2019
- December 2018
- November 2018
- October 2018
- September 2018
- August 2018
- July 2018
- June 2018
- May 2018
- April 2018
- March 2018
- February 2018
- January 2018
- December 2017
- November 2017
- October 2017
- September 2017
- August 2017
- July 2017
- June 2017
- May 2017
- April 2017
- March 2017
- February 2017
- January 2017
- December 2016
- November 2016
- October 2016
- September 2016
- August 2016
- July 2016
- June 2016
- May 2016
- April 2016
- March 2016
- February 2016
- January 2016
- December 2015
- November 2015
- October 2015
- September 2015
- August 2015
- July 2015
- June 2015
- May 2015
- April 2015
- March 2015
- February 2015
- January 2015
- December 2014
- November 2014
- October 2014
- September 2014
- August 2014
- July 2014
- June 2014
- May 2014
- April 2014
- March 2014
- February 2014
- January 2014
- December 2013
- November 2013
- October 2013
- September 2013
- August 2013
- July 2013
- June 2013
- May 2013
- April 2013
- March 2013
- February 2013
- January 2013
- December 2012
- November 2012
- October 2012
- September 2012
- August 2012
- July 2012
- June 2012
- May 2012
- April 2012
- March 2012
- February 2012
- January 2012
- December 2011
- November 2011
- October 2011
- September 2011
- August 2011
- July 2011
- June 2011
- May 2011
- April 2011
- March 2011
- February 2011
- January 2011
- December 2010
- November 2010
- October 2010
- September 2010
- August 2010
- July 2010
- June 2010
- May 2010
- April 2010
- March 2010
- February 2010
- January 2010
- December 2009
- November 2009
- October 2009
- September 2009
- August 2009
- July 2009
- June 2009
- May 2009
- April 2009
- March 2009
- February 2009
- January 2009
- December 2008
- November 2008
- October 2008
- September 2008
- August 2008
- July 2008
- June 2008
- May 2008
- April 2008
- March 2008
- February 2008
- January 2008
- December 2007
- November 2007
- October 2007
- September 2007
- August 2007
- July 2007
- June 2007
- May 2007
- April 2007
- March 2007
- February 2007
- January 2007
- December 2006
- November 2006
- October 2006
- September 2006
- August 2006
- July 2006
- June 2006
- May 2006
- April 2006
- March 2006
- February 2006
- January 2006
- December 2005
- November 2005
- October 2005
- September 2005
- August 2005
- July 2005
 Eddy Elfenbein is a Washington, DC-based speaker, portfolio manager and editor of the blog Crossing Wall Street. His