-
Bloomberg FTW
Posted by Eddy Elfenbein on August 15th, 2010 at 11:27 pmFinally, the Taleb bubble is starting to pop:
In February, he told a conference in Moscow that “every single human being” should bet Treasury bonds will decline. It’s a “no-brainer” to sell short the debt, he added. Since then, 2- and 10-year notes have rallied.
-
The Hindenburg Omen
Posted by Eddy Elfenbein on August 14th, 2010 at 3:49 pm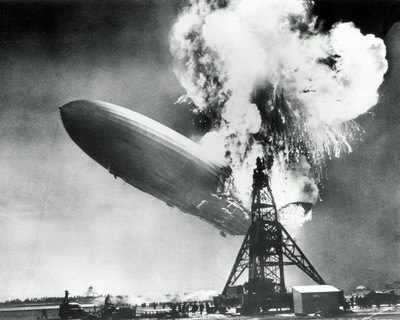
Like we don’t have enough to worry about, the stock market just tripped the dreaded Hindenburg Omen. That’s when an unusually high number of stocks reach 52-week highs and 52-week lows.
As you can probably guess from the name, the Hindenburg Omen means bad news as it’s named after the biggest disaster to hit the Garden State until the second season of Jersey Shore.
From Bloomberg:This week’s plunge in U.S. stocks triggered a technical indicator known as the Hindenburg Omen that may signal a more severe selloff, according to analysts who follow charts to predict market moves.
The market signal, named for a German zeppelin that caught fire and crashed more than seven decades ago, occurs when an unusually high number of companies in the New York Stock Exchange reach 52-week highs and lows. The indicator last occurred in October 2008, according to UBS AG.
The Standard & Poor’s 500 Index yesterday completed the biggest three-day decline since July 1, after an unexpected increase in unemployment claims added to evidence an economic recovery is weakening. The benchmark gauge for U.S. stocks has dropped 3.4 percent so far this week as Federal Reserve policy makers said growth “is likely to be more modest” than they previously forecast.
The indicator may suggest “a savage equity downturn is imminent,” said Albert Edwards, a London-based strategist at Societe Generale SA, who has told investors to favor bonds over stocks for more than a decade. “Equities are tottering on the edge as increasingly recessionary data becomes apparent. It would not take much to tip them over that edge.”
The Hindenburg signal was triggered yesterday as the proportion of stocks reaching new one-year highs and lows both exceeded 2.2 percent of the total listed on the NYSE, according to Michael Riesner, a technical analyst at UBS in Zurich.
Rising Market
The number of stocks at a 52-week high must not be more than twice the number marking lows, the technical theory also says, according to analysts. The indicator is only valid in a rising market, as defined by the NYSE Composite Index’s rolling average value in the last 10 weeks. It must also occur when the NYSE McClellan Oscillator, a measure of market momentum, is negative.
The Hindenburg Omen must be confirmed with a second occurrence within 36 days, according to Riesner. He said the signal occurred seven times in 2008 as the S&P 500 posted its biggest annual drop since the Great Depression.
“It’s an interesting name but what you really have as a technical background is a classic distribution phase in the market,” Riesner said. “It’s the classic tug of war between bulls and bears that you have there.”
In technical analysis, investors and analysts study charts of trading patterns and prices to predict changes in a security, commodity, currency or index. UBS is ranked as the top bank for equity technical analysis and charting according to a 2010 Thomson Extel survey. -
The Bond Bubble
Posted by Eddy Elfenbein on August 12th, 2010 at 5:16 pmJohnson & Johnson (JNJ) smartly takes advantage of the bond bubble. The rule is simple: When rates and stock prices are low, it’s better to raise money through debt. When stock prices and interest rates are high, issue stock.
Johnson & Johnson sold $1.1 billion of debt at the lowest interest rates on record for 10-year and 30-year securities amid surging investor demand for corporate debt.
The drugmaker, in the first offering by a nonfinancial AAA rated company in 15 months, sold $550 million of 2.95 percent, 10-year notes and the same amount of 4.5 percent, 30-year bonds, according to data compiled by Bloomberg. That’s the lowest coupons for those maturities on record, according to Citigroup Inc. data going back to 1981.
“Even though some faith in the rating agencies has been blown, the triple-A is still sacred,” said Guy LeBas, chief fixed-income strategist and economist at Janney Montgomery Scott LLC in Philadelphia.JNJ’s dividend yields 3.6%. This means that you could issue as much 10-year debt as you can and use it to buy the shares. The stock can rise another 22% from here and you’re still getting a higher yield than your interest payments (.036/.0295=1.22). And that doesn’t count the likely dividend increases.
I guess the obituaries for the Equity Risk Premium were a bit premature. -
Stocks Versus Bonds
Posted by Eddy Elfenbein on August 12th, 2010 at 2:11 pmThe current estimate for this year’s EPS for the S&P 500 is $83.11
Going by the current price for the S&P 500 and current yield for the 10-year T-bond, the 10-year T-bond will earn an equivalent of $29.41.
Think about that: $83.11 versus $29.41. -
Executive Order 9250
Posted by Eddy Elfenbein on August 12th, 2010 at 1:48 pmEver heard of FDR’s Executive Order 9250 which established a tax rate of 100% at $25,000. Yes, it really happened?
Here’s a sample:7. In order to correct gross inequities and to provide for greater equality in contributing to the war effort, the Director is authorized to take the necessary action, and to issue the appropriate regulations, so that, insofar as practicable no salary shall be authorized under Title III, Section 4, to the extent that it exceeds $25,000 after the payment of taxes allocable to the sum in excess of $25,000. Provided, however, that such regulations shall make due allowance for the payment of life insurance premiums on policies heretofore issued, and required payments on fixed obligations heretofore incurred, and shall make provision to prevent undue hardship.
-
GM to IPO
Posted by Eddy Elfenbein on August 12th, 2010 at 11:33 amGeneral Motors, a division of the U.S. government, just reported Q2 net income of $1.5 billion. Not too bad. But the big news is that the CEO Ed Whitacre is out and the company is gearing up for an IPO. This will be one of the most anticipated offerings ever.
One old rule of investing is to pay attention whenever a government has a yard sale. You can often pick up cheap bargains. In fact, that’s how Carlos Slim and Silvio Berlusconi made their big bucks.
GM is planning to raise between $12 billion and $16 billion in a public offering. According to reports, the IPO will involve 20% of the company’s shares. Since Uncle Sam currently owns 61%, the IPO would bring the governments total to under 50%.
My only fear is that the current market is a rotten environment for an IPO. Debt is loved and stocks are unloved. That tells me that it’s a better call for GM to issue bonds and buy the Treasury’s shares from them. -
28 Years Ago
Posted by Eddy Elfenbein on August 12th, 2010 at 11:05 amIt was 28 years ago today that the 1982-2000 bull market started. The Dow closed at 776.92 on August 12, 1982.
Just like this year, the following day was a Friday the 13th. In fact, two movies opened that Friday, Friday the 13th, Part 3 and Fast Times at Ridgemont High. As Gary Alexander points out, it was five years later, on August 13, 1987, that the Dow broke 2700 for the first time. That was a 250% rally!
Gary writes:Since the big 1982-99 bull market began on Friday, August 13, 1982, there have been 46 trading days falling on Friday the 13th, with a historical record of more than 2-to-1 positive outcomes: We’ve seen 31 up and 15 down days (67% positive). More recently, six of the last seven Friday the 13th markets have risen, including a whopper (+165.77) on June 13, 2008, right before the financial crisis struck in October.
Basically, when we’re in a bull market, Friday the 13th becomes exceptionally lucky. During the 1990s bull market, stocks rose 13 times (vs. 3 down days) on Friday the 13th. However, there were four straight declining Friday the 13th trading days from 2002 to 2004, as the big bear market of 2000-03 ended. -
I Didn’t Realize the Reversion was Going to be so Mean!
Posted by Eddy Elfenbein on August 12th, 2010 at 10:40 amUgh! The market is getting hit hard for the second day in a row. The S&P 500 was down -2.82% yesterday and we’ve been down by as much as -1.17% today. Some buyers seem to be crawling out from their hiding places, but we’ll have to see what happens.
Clearly, investors were spooked by this week’s Fed decision, plus some poor economic reports and Cisco’s results. Let me caution you to wait this one out. The fact is that interest rates are already so low, there’s not much place else for investors to go but stocks and gold—and the latter trade is looking very crowded.
The 10-year T-bond dipped under 2.7% recently which is just…nuts. That means that the government will pay you just 27% over the next ten years for the privilege of renting your money. I think this isn’t so much a statement on the U.S. government’s finances and it’s one about the level of anxiety of investors. A 10-year at 2.7% is basically throwing in the towel and refusing to play anymore.
For individual names, I really like Intel (INTC) below $20 a share. -
The 5-Year TIPs Have Gone Blutarsky
Posted by Eddy Elfenbein on August 11th, 2010 at 2:22 pmThe yield on the 5-Year Treasury Inflation Protected Bond has dropped to 0.0. Here’s a chart of the 5-year and 10-year TIPs (Felix’s chart is much bigger).
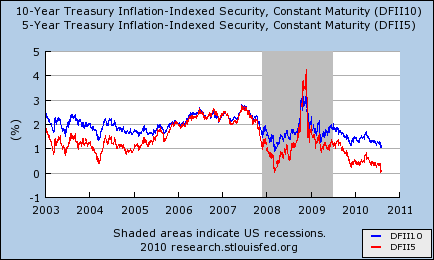
To me, this is pretty astounding. There are investors who are willing to stash their money away for five years, just to get no real return for it. They’re terrified to step off the pier even a tiny bit. -
The Four-Day Work Week
Posted by Eddy Elfenbein on August 11th, 2010 at 12:52 pmI’ve long argued that being lazy is an advantage with investing.
Spurred on by my previous post showing how the market has performed this year by each day of the week, I looked at how the S&P 500 performed has performed since the beginning of 2009 if we were to exclude all Fridays.
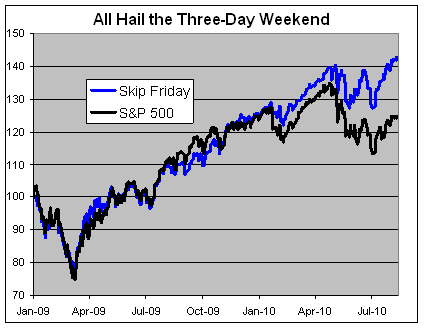
I should add that these numbers don’t include transaction costs. It seems that investors have grown leery of holding stocks going into the weekend.
- Tweets by @EddyElfenbein
-
-
Archives
- September 2024
- August 2024
- July 2024
- June 2024
- May 2024
- April 2024
- March 2024
- February 2024
- January 2024
- December 2023
- November 2023
- October 2023
- September 2023
- August 2023
- July 2023
- June 2023
- May 2023
- April 2023
- March 2023
- February 2023
- January 2023
- December 2022
- November 2022
- October 2022
- September 2022
- August 2022
- July 2022
- June 2022
- May 2022
- April 2022
- March 2022
- February 2022
- January 2022
- December 2021
- November 2021
- October 2021
- September 2021
- August 2021
- July 2021
- June 2021
- May 2021
- April 2021
- March 2021
- February 2021
- January 2021
- December 2020
- November 2020
- October 2020
- September 2020
- August 2020
- July 2020
- June 2020
- May 2020
- April 2020
- March 2020
- February 2020
- January 2020
- December 2019
- November 2019
- October 2019
- September 2019
- August 2019
- July 2019
- June 2019
- May 2019
- April 2019
- March 2019
- February 2019
- January 2019
- December 2018
- November 2018
- October 2018
- September 2018
- August 2018
- July 2018
- June 2018
- May 2018
- April 2018
- March 2018
- February 2018
- January 2018
- December 2017
- November 2017
- October 2017
- September 2017
- August 2017
- July 2017
- June 2017
- May 2017
- April 2017
- March 2017
- February 2017
- January 2017
- December 2016
- November 2016
- October 2016
- September 2016
- August 2016
- July 2016
- June 2016
- May 2016
- April 2016
- March 2016
- February 2016
- January 2016
- December 2015
- November 2015
- October 2015
- September 2015
- August 2015
- July 2015
- June 2015
- May 2015
- April 2015
- March 2015
- February 2015
- January 2015
- December 2014
- November 2014
- October 2014
- September 2014
- August 2014
- July 2014
- June 2014
- May 2014
- April 2014
- March 2014
- February 2014
- January 2014
- December 2013
- November 2013
- October 2013
- September 2013
- August 2013
- July 2013
- June 2013
- May 2013
- April 2013
- March 2013
- February 2013
- January 2013
- December 2012
- November 2012
- October 2012
- September 2012
- August 2012
- July 2012
- June 2012
- May 2012
- April 2012
- March 2012
- February 2012
- January 2012
- December 2011
- November 2011
- October 2011
- September 2011
- August 2011
- July 2011
- June 2011
- May 2011
- April 2011
- March 2011
- February 2011
- January 2011
- December 2010
- November 2010
- October 2010
- September 2010
- August 2010
- July 2010
- June 2010
- May 2010
- April 2010
- March 2010
- February 2010
- January 2010
- December 2009
- November 2009
- October 2009
- September 2009
- August 2009
- July 2009
- June 2009
- May 2009
- April 2009
- March 2009
- February 2009
- January 2009
- December 2008
- November 2008
- October 2008
- September 2008
- August 2008
- July 2008
- June 2008
- May 2008
- April 2008
- March 2008
- February 2008
- January 2008
- December 2007
- November 2007
- October 2007
- September 2007
- August 2007
- July 2007
- June 2007
- May 2007
- April 2007
- March 2007
- February 2007
- January 2007
- December 2006
- November 2006
- October 2006
- September 2006
- August 2006
- July 2006
- June 2006
- May 2006
- April 2006
- March 2006
- February 2006
- January 2006
- December 2005
- November 2005
- October 2005
- September 2005
- August 2005
- July 2005
 Eddy Elfenbein is a Washington, DC-based speaker, portfolio manager and editor of the blog Crossing Wall Street. His