-
Are Investors Sexist?
Posted by Eddy Elfenbein on August 6th, 2010 at 11:09 pmHaving women on your board doesn’t hurt your profits, but it apparently hurts your stock.
In terms of a firm’s profitability, appointing women to the board of directors has very little, if any, effect, says Harvard sociologist Frank Dobbin. Yet the same cannot be said of stock value, which tends to decline slightly, according to his forthcoming paper that draws on data from 429 U.S. firms. He attributes it to “unconscious investor bias,” particularly among those with smaller holdings who “likely do not inspect their own motives for buying or selling stock.”
But the consequences of their decisions add up. According to another study published in the British Journal of Management, from 2001 to 2005, FTSE 100 companies with male-only boards were valued at 37% higher than those with women on the board—“a massive number,” says author Alex Haslam.As a stock-picker, that’s fine by me. It’ll be easier for me to spot undervalued stocks.
-
Today’s Rotten Jobs Report
Posted by Eddy Elfenbein on August 6th, 2010 at 10:56 amThe official numbers came out today and the nation’s jobless rate held steady at 9.5%. Even though the economy is no longer receding, it’s not growing very quickly at all. The economy needs to grow at a certain pace just to absorb the new workers that enter the workforce. If not, the unemployment rate grows, or at best, it stagnates.
The private workforce grew by 71,000 jobs last month. That’s below expectations and it comes on top of the June number which was revised downward by 31,000. The complete data shows that the economy lost 131,000 jobs in July but that includes many census workers.
The other problem is that many people are simply leaving the job market all together. The seasonally-adjusted size of the civilian workforce is less than what it was in late 2007.“The private sector is still hobbled and certainly is not nearly strong enough to overcome the drain on the government side,” said Robert A. Dye, senior economist at PNC Financial Services Group in Pittsburgh.
Mr. Dye added that employers were pushing for productivity gains among existing workers, as evidenced by a slight increase in the average workweek for private workers. “I think that many employers are realizing that they can get by with very lean payrolls and are pushing their employees as much as they can and without adding,” he said.
Although the unemployment rate did not worsen, that was in part because people continued to leave the labor force, which means they simply stopped looking for work during the month. In July, 181,000 people left the labor force.If the employment-to-population ratio were the same as it was 10 years ago, then there would be 13.7 million more jobs.
-
What It’s Like Working at Goldman Sachs
Posted by Eddy Elfenbein on August 5th, 2010 at 1:33 pmWall Street, like Scientology, has an all-inclusive and claustrophobic value system all its own. Particularly at Goldman Sachs, which prided itself as a breed apart from other firms, this provincialism went even further. Former employees who had left Goldman were rarely mentioned. The unanimous phrase for it was ‘no longer with the firm,’ said in the same tone used to describe the passing of a family member.
This tendency reached the height of comedy inside the strategies division, where some of the quants published academic papers on the more theoretical aspects of their work. If an author quit Goldman though, his name would be removed from the official version of the publication. It got to the point that some papers had no authors, and had apparently written themselves. So it goes. No longer with the firm.Read the whole thing.
-
Update on the 10-year/30-Year T-Bond Spread
Posted by Eddy Elfenbein on August 4th, 2010 at 11:53 pmEarlier I wrote, “the S&P 500 hasn’t shown any net capital gain whenever the 10-year/30-year spread is wider than 43 basis points.”
That’s correct, however, I looked into the numbers a little more and it seems that the recent financial crisis had an unusual impact on this data series.
In my mind, a positive spread ought to have a positive impact on equity prices. I found that if I take out the period from October 2007 to March 9, 2009—yeah, I know, that’s a very big if—then numbers start to make more sense. Suddenly, a positive 10/30 spread is good for stocks.
After taking out that awful 17-month stretch, here’s what I found. Stocks do well whenever the 10/30 spread is greater than -33 basis points (that’s about 95% of the time). Stocks do especially well when the spread is greater than 11 basis points which is about 63% of the time. A spread of more than 11 points translates to an annualized gain of 15.6% (not including dividends). When the spread is less than 11 basis points, the annualized gain is just 1%. To reiterate, we’re now at the highest spread ever.
So is what I’m doing kosher? Errr…it’s hard to say. I can be accused of data-mining because that’s exactly what I’m doing. However, as an analyst, we have to look at our data in context. When the world was falling apart, the numbers started to make very little sense. It’s almost like putting a magnet near a compass—all the readings go kablooey.
Ultimately, I think it’s ok to play with numbers like this as long as we understand that we’re looking at models of the market. When things get hot, any historical relationship can and will break down. -
Nicholas Financial Rings the Closing Bell
Posted by Eddy Elfenbein on August 4th, 2010 at 8:39 pmHere’s the video and some pictures.
-
Thanks Nancy
Posted by Eddy Elfenbein on August 4th, 2010 at 4:48 pmFrom Mark Hulbert:
(T)he Dow between 1897 and 2004 produced an annualized return of 5.3% when Congress was out of session, in contrast to just 0.4% when it was in session.
CNN:
House to return from summer break next week, Pelosi says
(Via: Abnormal Returns)
-
Record Spread Between 10-Year and 30-Year Treasury Bonds
Posted by Eddy Elfenbein on August 4th, 2010 at 10:52 amThe spread between the 10-year (^TNX) and 30-year Treasury (^TYX) is now at its widest spread ever since the 30-year started trading in 1977.
Here’s a look at the two yields:
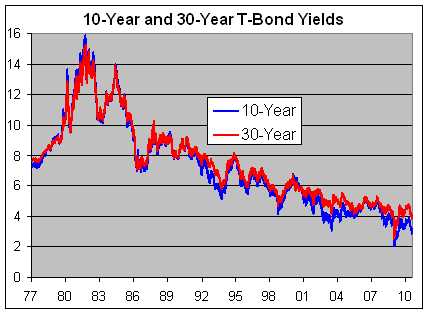
As you can see, the two bonds track each other pretty closely so it’s hard to see the difference. Here’s a look at just the difference between the two:

The spread is now at 114 basis points. We just took out the previous high of 111 points from October 6, 1992.
So what does this mean for the stock market? It’s hard to say. It could mean that the deflation bet is off the table for now.
I ran the numbers and was surprised to learn that the S&P 500 hasn’t shown any net capital gain whenever the 10-year/30-year spread is wider than 43 basis points. -
Polo Ralph Lauren Beats by 32 Cents
Posted by Eddy Elfenbein on August 4th, 2010 at 10:30 amThis morning’s earnings report from Polo Ralph Lifshitz (RL) really caught my eye. Earnings grew by 57%. The company earned $1.21 per share which is 32 cents better than expectations. That’s a huge earnings beat. RL said that for this quarter it expects sales to grow at a high-single-digits pace, although operating margins won’t be as high.
The company saw the gradual return of luxury customers late last year. However, in May it anticipated pressure from the euro’s recent woes and rising raw-materials and labor costs. Polo in recent years has been expanding in Asia—where many high-end brands are seeking growth as North American and European markets slow—and the company recently agreed to take control of its distribution in South Korea.
Clothing retailers, especially luxury brands, were hurt last year as consumers cut spending. Polo was shielded from some of the declines because each of its brands has its own distribution channel and target customer.The stock is currently going for less than 15 times the estimate for next fiscal year (ending March 2012).
-
Jobs Report Lifts Stocks
Posted by Eddy Elfenbein on August 4th, 2010 at 9:55 amGood news for Intel (INTC) today. The Federal Trade Commission said it has reached a deal with Intel regarding an anti-trust case. The problem was that Intel wasn’t charging people enough for its chips. I’m not making that up.
Like many anti-trust cases, the complaint wasn’t brought by a customer but by one of Intel’s competitors, Advanced Micro Devices (AMD). The two companies settled a civil trial last year when Intel had to fork over $1.25 billion.
The good news is that this time Intel won’t pay a dime in damages. Instead, the company will have to alter the way it sells some of its products.
The market is in a good mood this morning thanks to an optimistic jobs report from ADP. On Friday, we’ll get the official employment report from the government but the private payroll company likes to provide its own sneak-peak. According to ADP, payrolls grew by 42,000 last month and the figure for June was revised higher to a gain of 19,000. I’m not very impressed by those number but at least they’re positive! -
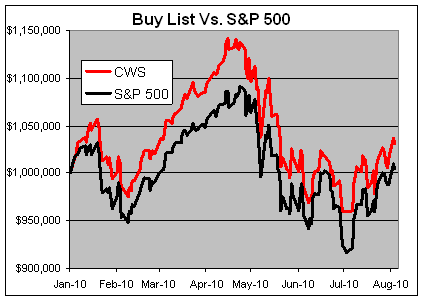
Buy List YTD
Posted by Eddy Elfenbein on August 3rd, 2010 at 4:23 pmHere’s an update on how the Buy List is doing so far this year. Through today, the average of the 20 stocks is up 3.03% compared with 0.48% for the S&P 500 (neither figure includes dividends). We’re on track for beating the market for the fourth straight year.
The rules of the Buy List are that I chose 20 stocks at the beginning of the year. Once they’re chosen, it’s set. I can’t make any changes during the entire year.
For tracking purposes, I assume the Buy List is a $1 million portfolio, equally weighted with $50,000 in 20 different positions as of the closing price of the previous year. Each year, I only change five of the stocks.
By mid-April, we had a big 6% lead over the market but that’s been cut in half since then. We’re still 2.55% ahead of the market.
Here’s our stock-by-stock record:Company Profit or Loss AFL 7.70% BAX -24.30% BDX -10.65% BBBY -0.73% EV -0.07% LLY 2.44% FISV 4.50% GILD -20.31% INTC 2.30% JNJ -7.86% JOSB 36.90% LUK -4.20% MDT -14.53% MOG-A 22.99% NICK 26.85% RAI 8.48% SEIC 11.47% SYK -5.18% SYY 12.53% WXS 12.37% If you started the year with, say, $10 billion and followed my advice, I would have made you over $300 million.
And I don’t charge nothing neither!
- Tweets by @EddyElfenbein
-
-
Archives
- September 2024
- August 2024
- July 2024
- June 2024
- May 2024
- April 2024
- March 2024
- February 2024
- January 2024
- December 2023
- November 2023
- October 2023
- September 2023
- August 2023
- July 2023
- June 2023
- May 2023
- April 2023
- March 2023
- February 2023
- January 2023
- December 2022
- November 2022
- October 2022
- September 2022
- August 2022
- July 2022
- June 2022
- May 2022
- April 2022
- March 2022
- February 2022
- January 2022
- December 2021
- November 2021
- October 2021
- September 2021
- August 2021
- July 2021
- June 2021
- May 2021
- April 2021
- March 2021
- February 2021
- January 2021
- December 2020
- November 2020
- October 2020
- September 2020
- August 2020
- July 2020
- June 2020
- May 2020
- April 2020
- March 2020
- February 2020
- January 2020
- December 2019
- November 2019
- October 2019
- September 2019
- August 2019
- July 2019
- June 2019
- May 2019
- April 2019
- March 2019
- February 2019
- January 2019
- December 2018
- November 2018
- October 2018
- September 2018
- August 2018
- July 2018
- June 2018
- May 2018
- April 2018
- March 2018
- February 2018
- January 2018
- December 2017
- November 2017
- October 2017
- September 2017
- August 2017
- July 2017
- June 2017
- May 2017
- April 2017
- March 2017
- February 2017
- January 2017
- December 2016
- November 2016
- October 2016
- September 2016
- August 2016
- July 2016
- June 2016
- May 2016
- April 2016
- March 2016
- February 2016
- January 2016
- December 2015
- November 2015
- October 2015
- September 2015
- August 2015
- July 2015
- June 2015
- May 2015
- April 2015
- March 2015
- February 2015
- January 2015
- December 2014
- November 2014
- October 2014
- September 2014
- August 2014
- July 2014
- June 2014
- May 2014
- April 2014
- March 2014
- February 2014
- January 2014
- December 2013
- November 2013
- October 2013
- September 2013
- August 2013
- July 2013
- June 2013
- May 2013
- April 2013
- March 2013
- February 2013
- January 2013
- December 2012
- November 2012
- October 2012
- September 2012
- August 2012
- July 2012
- June 2012
- May 2012
- April 2012
- March 2012
- February 2012
- January 2012
- December 2011
- November 2011
- October 2011
- September 2011
- August 2011
- July 2011
- June 2011
- May 2011
- April 2011
- March 2011
- February 2011
- January 2011
- December 2010
- November 2010
- October 2010
- September 2010
- August 2010
- July 2010
- June 2010
- May 2010
- April 2010
- March 2010
- February 2010
- January 2010
- December 2009
- November 2009
- October 2009
- September 2009
- August 2009
- July 2009
- June 2009
- May 2009
- April 2009
- March 2009
- February 2009
- January 2009
- December 2008
- November 2008
- October 2008
- September 2008
- August 2008
- July 2008
- June 2008
- May 2008
- April 2008
- March 2008
- February 2008
- January 2008
- December 2007
- November 2007
- October 2007
- September 2007
- August 2007
- July 2007
- June 2007
- May 2007
- April 2007
- March 2007
- February 2007
- January 2007
- December 2006
- November 2006
- October 2006
- September 2006
- August 2006
- July 2006
- June 2006
- May 2006
- April 2006
- March 2006
- February 2006
- January 2006
- December 2005
- November 2005
- October 2005
- September 2005
- August 2005
- July 2005
 Eddy Elfenbein is a Washington, DC-based speaker, portfolio manager and editor of the blog Crossing Wall Street. His