-
Sysco Under $29
Posted by Eddy Elfenbein on July 6th, 2010 at 12:03 pmIf you’re looking for a decent bargain, shares of Sysco (SYY) look pretty good now that they’re under $29. Thanks to the market’s recent unpleasantness, the stock has gotten as low as $28.46.
Sysco is a conservative company. They pay a 25-cent quarterly dividend, so the current yield is about 3.5% which is well above the 10-year T-bond yield.
Sysco’s business had been feeling the squeeze of lower prices. The company saw three straight quarters of declining earnings (not a lot, but declining). They responded by cutting overhead and their earnings started to perk up. Last quarter was interesting because it was the first time since 2008 that sales also grew. That’s very good news because you can’t cut overhead forever, you need to start growing your sales.
Sysco has now beaten earnings for four straight quarters. Sysco reports late so the next earnings report probably won’t come out until around August 10. Plus, Sysco’s fiscal year ends on June 30 so this upcoming report will be for their fiscal fourth quarter.
The company will probably earn around 60 cents a share, give or take which comes out to $1.96 for the year. At $29 a share, that’s not bad. I don’t expect Sysco to grow its earnings by a lot for their next fiscal year, but they almost certainly should be higher than last year. -
Prechter Calls for Dow 1,000
Posted by Eddy Elfenbein on July 6th, 2010 at 10:08 amThe New York Times recently profiled Robert Prechter and his call for the Dow to fall to 1,000.
If you’re not familiar with Mr. Prechter, he’s a follower of an obscure accountant named RN Elliott who claimed to have discovered that the stock market follows a predictable pattern which is somehow (don’t ask me) related to the Fibonacci Sequence.“I’m saying: ‘Winter is coming. Buy a coat,’ ” he said. “Other people are advising people to stay naked. If I’m wrong, you’re not hurt. If they’re wrong, you’re dead. It’s pretty benign advice to opt for safety for a while.”
His advice: individual investors should move completely out of the market and hold cash and cash equivalents, like Treasury bills, for years to come. (For traders with a fair amount of skill and willingness to embrace risk, he suggests other alternatives, like shorting the market or making bets on volatility.) But ultimately, “the decline will lead to one of the best investment opportunities ever,” he said.
Buy-and-hold stock investors will be devastated in a crash much worse than the declines of 2008 and early 2009 or the worst years of the Great Depression or the Panic of 1873, he predicted.
For a rough parallel, he said, go all the way back to England and the collapse of the South Sea Bubble in 1720, a crash that deterred people “from buying stocks for 100 years,” he said. This time, he said, “If I’m right, it will be such a shock that people will be telling their grandkids many years from now, ‘Don’t touch stocks.’ ”
The Dow, which now stands at 9,686.48, is likely to fall well below 1,000 over perhaps five or six years as a grand market cycle comes to an end, he said. That unraveling, combined with a depression and deflation, will make anyone holding cash “extremely grateful for their prudence.”I believe that people make too much of incorrect forecasts. I don’t expect anyone to be able to predict the future with a high degree of accuracy, but Prechter is way, way out there.
Even if the Dow started to plunge, I would bet that the companies would be nationalized before they got down to Dow 2,000. I’m guessing the Dow companies have 1,000 points worth of cash alone. There’s also the most difficult questions of betting in favor of Armageddon — if you’re right, how do you collect and whom do you collect from? Mad Max?? -
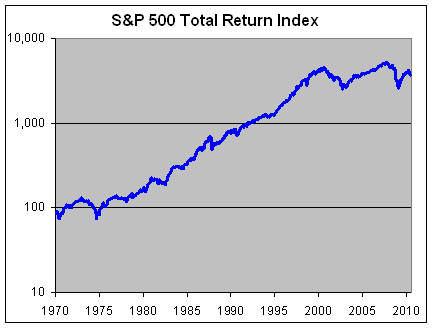
The Long View
Posted by Eddy Elfenbein on July 6th, 2010 at 9:30 amEven after adjusting for dividends, the S&P 500 is back where it was 10-1/2 years ago.
-
Welcome Back!
Posted by Eddy Elfenbein on July 6th, 2010 at 7:35 amI hope everyone had a great Fourth of July weekend. The early indications are that the market will rally today. Geez, it’s about time! Thanks to another dismal jobs report the S&P 500 closed Friday at 1,022 which was the lowest close since last September. For an economic recovery, ten months with no stock gains isn’t much of a recovery.
The good news is that earnings season will start next week. Aloca (AA) is usually the first major company to report and they’re scheduled to report next Monday. JPMorgan Chase (JPM) will report next Thursday and General Electric (GE) reports next Friday. Those are the early birds and they’ll give us an indication of how things will shake out.
I’m expecting pretty decent earnings growth for the stock market. For the second quarter of 2009, the S&P 500 earned $13.81 per share and I expect Q2 earnings for this year to be around $20 per share.
That may sound like tremendous growth but profits are really rebounding from very low levels. (very, very, very low levels).
Even though the economic recovery is proving to be rather weak, the past earnings have been so poor that it’s not to hard to show earnings growth coming off depressed levels. The S&P 500 will probably earn around $80 to $85 per share this year which means the market is currently going for about 12 to 13 times this year’s earnings. That’s just a guess but I think it’s a fairly reasonable one. This earnings season, many companies will give us a better idea of what to expect for the second half of 2010.
I continue to think that equity prices look good at this level, especially since you can’t even make 3% in a 10-year Treasury bond. The problem is that the market has been going down despite the low prices. As always, the market is in charge and we’re just following along.
Long for nice gains from AFLAC (AFL) and Medtronic (MDT). The Buy List has outperformed the S&P 500 for the last five sessions and eight of the last nine sessions. -
Herb on the Street
Posted by Eddy Elfenbein on July 1st, 2010 at 4:32 pm -
Some Numbers from Today
Posted by Eddy Elfenbein on July 1st, 2010 at 1:49 pmGoldman Sachs (GS) has traded as low as $129.50 today. Their book value is $128.33.
Morgan Stanley (MS) is now 17% below its book value.
A two-year US Treasury will yield you about 0.5%. One share of Johnson & Johnson (JNJ) yields about seven times that. -
The Dow Yields More than the 10-Year
Posted by Eddy Elfenbein on July 1st, 2010 at 11:35 amThanks to an ugly day in the markets, the yield on the 10-year Treasury stands at 2.899%. The indicated yield for the Dow is 2.97%.
-
ISM Index Drops
Posted by Eddy Elfenbein on July 1st, 2010 at 10:09 amThe ISM report came out today and it showed a drop from 59.7 in May to 56.2 for June. As I’ve written before, the ISM report is probably one of the best indicators for telling us if the economy is in a recession or not.
Any reading above 50 indicates that the economy is growing. Below 50 means it’s shrinking. Even though the reading is still above 50, this was a big drop from May. This is the biggest drop since late 2008. Wall Street was expecting a drop but only to 59.
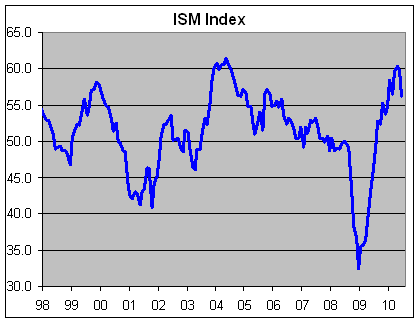
The Institute for Supply Management noted in today’s press release that “if the PMI for June (56.2 percent) is annualized, it corresponds to a 4.8 percent increase in real GDP annually.” -
Mid-Year Report Card
Posted by Eddy Elfenbein on June 30th, 2010 at 4:38 pmThe first half of the year is now over. Overall, it’s been an ugly time for the stock market. The S&P 500 is down -7.57% for the first half and our Buy List is down -4.00%.
To reiterate the rules of the Buy List, it’s a list of 20 stocks that I choose at the beginning of each year. Once the list is set, I can’t make any changes throughout the year. I assume the portfolio is equally weighted at the start of the year.
Here’s a look at each stock on our Buy List, the price at the beginning of the year, the price at the close of today and the profit/loss:Symbol Buy Current Profit AFL $46.25 $42.67 -7.74% BAX $58.68 $40.64 -30.74% BDX $78.86 $67.62 -14.25% BBBY $38.61 $37.08 -3.96% EV $30.41 $27.61 -9.21% LLY $35.71 $33.50 -6.19% FISV $48.48 $45.66 -5.82% GILD $43.27 $34.28 -20.78% INTC $20.40 $19.45 -4.66% JNJ $64.41 $59.06 -8.31% JOSB $42.19 $53.99 27.97% LUK $23.79 $19.51 -17.99% MDT $43.98 $36.27 -17.53% MOG-A $29.23 $32.23 10.26% NICK $6.89 $8.23 19.45% RAI $52.97 $52.12 -1.60% SEIC $17.52 $20.36 16.21% SYK $50.37 $50.06 -0.62% SYY $27.94 $28.57 2.25% WXS $31.86 $29.70 -6.78% Our biggest winner is Jos. A Bank Clothiers (JOSB), followed by Nicholas Financial (NICK) and SEI Investments (SEIC).
Our biggest loser is Baxter International (BAX) followed by Gilead Sciences (GILD).
Here’s how the Buy List has done compared with the market during the first half of the year. I track the Buy List as if it’s a $1 million portfolio.
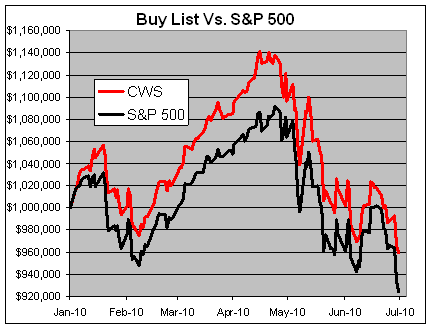
We had a great start to the year. By April 15, we were up 14.1% which was more than 5% ahead of the S&P 500. Since then, our Buy List has shed -15.88% compared with -14.93% for the S&P 500.
Including dividends, the Buy List is down -3.19% for the year while the S&P 500 is down -6.65%. Four the four-and-a-half years of the Buy List combined, we’re up 11.26% versus a loss of -9.15% for the S&P 500.
Finally, if this matters to anyone, the beta for this year is running at 0.917. Historically, our beta is 0.938. -
Some Context
Posted by Eddy Elfenbein on June 30th, 2010 at 3:49 pmWe’re now 1.05% of our way through the millennium. That’s the same ratio that a three-year Treasury will do for you.
- Tweets by @EddyElfenbein
-
-
Archives
- September 2024
- August 2024
- July 2024
- June 2024
- May 2024
- April 2024
- March 2024
- February 2024
- January 2024
- December 2023
- November 2023
- October 2023
- September 2023
- August 2023
- July 2023
- June 2023
- May 2023
- April 2023
- March 2023
- February 2023
- January 2023
- December 2022
- November 2022
- October 2022
- September 2022
- August 2022
- July 2022
- June 2022
- May 2022
- April 2022
- March 2022
- February 2022
- January 2022
- December 2021
- November 2021
- October 2021
- September 2021
- August 2021
- July 2021
- June 2021
- May 2021
- April 2021
- March 2021
- February 2021
- January 2021
- December 2020
- November 2020
- October 2020
- September 2020
- August 2020
- July 2020
- June 2020
- May 2020
- April 2020
- March 2020
- February 2020
- January 2020
- December 2019
- November 2019
- October 2019
- September 2019
- August 2019
- July 2019
- June 2019
- May 2019
- April 2019
- March 2019
- February 2019
- January 2019
- December 2018
- November 2018
- October 2018
- September 2018
- August 2018
- July 2018
- June 2018
- May 2018
- April 2018
- March 2018
- February 2018
- January 2018
- December 2017
- November 2017
- October 2017
- September 2017
- August 2017
- July 2017
- June 2017
- May 2017
- April 2017
- March 2017
- February 2017
- January 2017
- December 2016
- November 2016
- October 2016
- September 2016
- August 2016
- July 2016
- June 2016
- May 2016
- April 2016
- March 2016
- February 2016
- January 2016
- December 2015
- November 2015
- October 2015
- September 2015
- August 2015
- July 2015
- June 2015
- May 2015
- April 2015
- March 2015
- February 2015
- January 2015
- December 2014
- November 2014
- October 2014
- September 2014
- August 2014
- July 2014
- June 2014
- May 2014
- April 2014
- March 2014
- February 2014
- January 2014
- December 2013
- November 2013
- October 2013
- September 2013
- August 2013
- July 2013
- June 2013
- May 2013
- April 2013
- March 2013
- February 2013
- January 2013
- December 2012
- November 2012
- October 2012
- September 2012
- August 2012
- July 2012
- June 2012
- May 2012
- April 2012
- March 2012
- February 2012
- January 2012
- December 2011
- November 2011
- October 2011
- September 2011
- August 2011
- July 2011
- June 2011
- May 2011
- April 2011
- March 2011
- February 2011
- January 2011
- December 2010
- November 2010
- October 2010
- September 2010
- August 2010
- July 2010
- June 2010
- May 2010
- April 2010
- March 2010
- February 2010
- January 2010
- December 2009
- November 2009
- October 2009
- September 2009
- August 2009
- July 2009
- June 2009
- May 2009
- April 2009
- March 2009
- February 2009
- January 2009
- December 2008
- November 2008
- October 2008
- September 2008
- August 2008
- July 2008
- June 2008
- May 2008
- April 2008
- March 2008
- February 2008
- January 2008
- December 2007
- November 2007
- October 2007
- September 2007
- August 2007
- July 2007
- June 2007
- May 2007
- April 2007
- March 2007
- February 2007
- January 2007
- December 2006
- November 2006
- October 2006
- September 2006
- August 2006
- July 2006
- June 2006
- May 2006
- April 2006
- March 2006
- February 2006
- January 2006
- December 2005
- November 2005
- October 2005
- September 2005
- August 2005
- July 2005
 Eddy Elfenbein is a Washington, DC-based speaker, portfolio manager and editor of the blog Crossing Wall Street. His