-
The Market’s Mid-Year Cycle
Posted by Eddy Elfenbein on June 30th, 2010 at 3:31 pmEarlier we pointed out that the stock market has had a very dramatic effect at the turn of each month. Since 1932, most of the S&P 500’s capital gain has come during a seven-day period at the turn of each month—specifically, the last four trading days and the first three trading days of each month. This represents about one-third of the total trading days. During the rest of the month, the stock market actually lost money.
Investing in just the last four days and first three days of each month would have returned over 63,000% (not including trading costs). Annualized, that’s 8.6%. However, if you consider that it’s really only 32% of the time, the true annualized rate is over 28%. The rest of the month—the other 68% of the time—has resulted in a combined loss of close to 78%.
It is important which month we’re talking about. The most dramatic surge comes at the turn of the year. During that seven-day stretch, the market has gained an average of 1.59%. The mid-year seven-day period is the fourth-best averaging a gain of 0.60%.
A few years ago, I ran the numbers on the entire history of the Dow and found that the Dow gains 1.37% between June 27 and July 6. Historically, there’s been an average gain of 4.17% from June 27 to September 6. Historically, the Dow has peaked on September 6 and pulled back until late October (and it’s not just 1929 distorting the series that causes this).
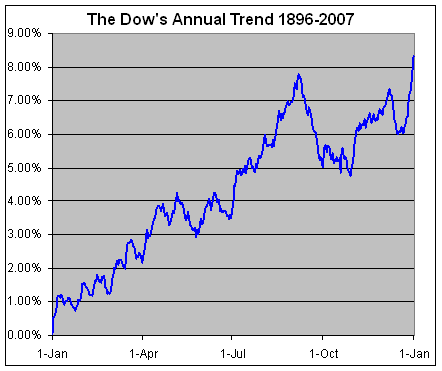
Please note that I don’t see these historical quirks as useful trading strategies. What I think is important is that the market clearly sees turning points at the different times of the year. -
The Higher Ed Bubble Continues
Posted by Eddy Elfenbein on June 30th, 2010 at 10:09 amMore evidence that the advantages of a college degree are vastly overrated:
“Some universities are getting paid to have people show up, take a class, and flunk out,” says Lee. “If you bought cars, and half the cars didn’t work within the first six months, and you couldn’t get your money back, people would be pretty outraged.”
-
S&P 500’s P/E Ratio Hits Lowest Level in 19 Months
Posted by Eddy Elfenbein on June 29th, 2010 at 11:19 pmHere’s a look at the S&P 500 (black line, left scale) along with its operating earnings (yellow line, right scale).
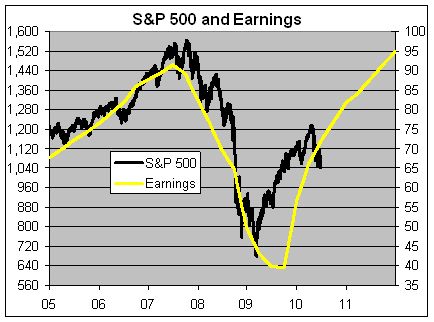
The two lines are scaled at a ratio of 16 to 1 so when the lines cross, the S&P’s price/earnings ratio is exactly 16. The future earnings is the consensus from analysts.
The current P/E Ratio is 14.49 which is the lowest level for the index since November 2008. To be fair, the market’s real P/E Ratio was a lot lower then since the earnings line was devastated by losses at AIG.
Here’s the S&P’s P/E Ratio going back to the 1980s.
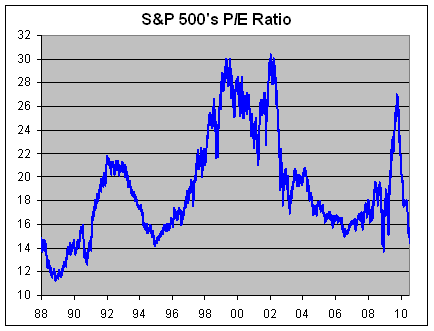
We’re not too far from hitting 20-year lows. -
The Yield on the Dow
Posted by Eddy Elfenbein on June 29th, 2010 at 10:41 pmAccording to the Wall Street Journal, here are the indicated dividends for the 30 Dow stocks:
AT&T Corp. $1.68 Verizon $1.90 Pfizer $0.72 DuPont $1.64 Merck $1.52 Kraft Foods $1.16 Chevron Corp $2.88 Johnson & Johnson $2.16 Coca-Cola $1.76 McDonald’s $2.20 Procter & Gamble $1.93 Home Depot $0.95 Intel $0.63 Exxon-Mobil $1.76 Travelers Cos. $1.44 Caterpillar $1.76 3M $2.10 General Electric $0.40 Boeing $1.68 United Tech $1.70 Wal-Mart Stores $1.21 IBM $2.60 Microsoft $0.52 American Express $0.72 Alcoa $0.12 Walt Disney $0.35 Hewlett-Packard $0.32 J.P. Morgan Chase $0.20 Bank of America $0.04 Cisco Systems $0.00 Using some complicated math, I added all the dividends together and got $38.05. The current divisor on the Dow is 0.132319125, so dividing by the divisor comes to 287.56.
The Dow closed today at 9,870.30, so the indicated dividend yield is 287.56 divided by 9,870.30 or 2.91%. The closing yield on the 10-year Treasury (^TNX) is 2.97%.
Of course the Dow’s dividends can be cut, but you’re really not getting much for the “safety” of Treasuries. -
Cognizant Tech CEO
Posted by Eddy Elfenbein on June 29th, 2010 at 5:25 pmOne of my favorite tech stocks is Cognizant Technology Solutions (CTSH). This was a gigantic winner for our Buy List last year (up over 150%).
I got rid of it for this year’s Buy List, although CTSH is up another 11.5% this year. Here’s the CEO on CNBC:
-
The Ten-Year Treasury Drops Below 3%
Posted by Eddy Elfenbein on June 29th, 2010 at 10:07 amThere’s not much to add that this chart doesn’t already say:
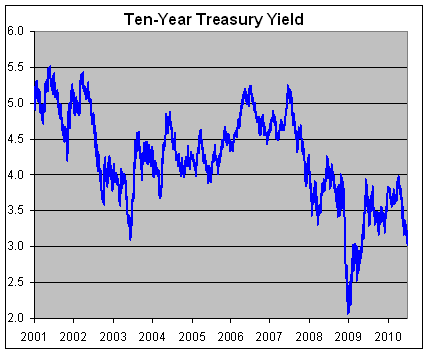
The yield on the ten-year Treasury (^TNX) has fallen below 3% which it hasn’t done since the height of the financial crisis (roughly, November of 2008 to April 2009).
The Dow is at 9900. I ran the numbers and found that the Dow currently yields 2.9%. Assuming the overall dividend number isn’t cut, the Dow needs to gain, on average, 10 points a year for the next 10 years to match what the 10-year is offering.
Either stocks are very cheap or Treasuries are way too expensive (or possibly both). As I’ve said before, the 10-year Treasury has a major impact on stock prices. -
QOTD
Posted by Eddy Elfenbein on June 29th, 2010 at 9:39 amFrom Ambrose Evans-Pritchard:
As for the Fed, I venture to say that a common jury of 12 American men and women placed on the Federal Open Market Committee would have done a better job of setting monetary policy over the last 20 years than Doctors Bernanke and Greenspan.
-
The Supremes Help Tobacco Stocks
Posted by Eddy Elfenbein on June 28th, 2010 at 2:26 pmThe market is doing very well for us today. AFLAC (AFL) spiked as high as $46.20 before pulling back below $45. It’s still holding on to a nice gain.
Reynolds American (RAI) is getting a nice boost thanks to the Supreme Court’s decision in favor of the tobacco companies. All the major tobacco stocks are doing well today. RAI got as high as $54 a share earlier today.
This is a very split market today. The consumer stocks are doing well while the economically sensitive stocks are down. The Morgan Stanley Consumer Index (^CMR) is up 0.52% while the Morgan Stanley Cyclical Index (^CYC) is down -0.65%. -
First in Business Worldwide
Posted by Eddy Elfenbein on June 28th, 2010 at 10:35 amJump ahead to the 7 minute mark:
(Via: ZeroHedge) -
Stock Buyback Fail
Posted by Eddy Elfenbein on June 28th, 2010 at 9:59 amI loathe stock buybacks, but this one really takes the cake.
Guess what oil company spent $37 billion in buying back its own stock between 2005 and 2008, only to see that investment drop to $15 billion today?
I’ll give you a hint: BP (BP).
That’s about $12 per share that went out the window.
A few weeks ago, several emailers asked if BP was a good buy. I said that a falling stock isn’t a cheap stock. It’s only cheaper compared to where it was. At the time, BP was at $38 a share. On Friday, the stock made a new 52-week low below $27.
- Tweets by @EddyElfenbein
-
-
Archives
- September 2024
- August 2024
- July 2024
- June 2024
- May 2024
- April 2024
- March 2024
- February 2024
- January 2024
- December 2023
- November 2023
- October 2023
- September 2023
- August 2023
- July 2023
- June 2023
- May 2023
- April 2023
- March 2023
- February 2023
- January 2023
- December 2022
- November 2022
- October 2022
- September 2022
- August 2022
- July 2022
- June 2022
- May 2022
- April 2022
- March 2022
- February 2022
- January 2022
- December 2021
- November 2021
- October 2021
- September 2021
- August 2021
- July 2021
- June 2021
- May 2021
- April 2021
- March 2021
- February 2021
- January 2021
- December 2020
- November 2020
- October 2020
- September 2020
- August 2020
- July 2020
- June 2020
- May 2020
- April 2020
- March 2020
- February 2020
- January 2020
- December 2019
- November 2019
- October 2019
- September 2019
- August 2019
- July 2019
- June 2019
- May 2019
- April 2019
- March 2019
- February 2019
- January 2019
- December 2018
- November 2018
- October 2018
- September 2018
- August 2018
- July 2018
- June 2018
- May 2018
- April 2018
- March 2018
- February 2018
- January 2018
- December 2017
- November 2017
- October 2017
- September 2017
- August 2017
- July 2017
- June 2017
- May 2017
- April 2017
- March 2017
- February 2017
- January 2017
- December 2016
- November 2016
- October 2016
- September 2016
- August 2016
- July 2016
- June 2016
- May 2016
- April 2016
- March 2016
- February 2016
- January 2016
- December 2015
- November 2015
- October 2015
- September 2015
- August 2015
- July 2015
- June 2015
- May 2015
- April 2015
- March 2015
- February 2015
- January 2015
- December 2014
- November 2014
- October 2014
- September 2014
- August 2014
- July 2014
- June 2014
- May 2014
- April 2014
- March 2014
- February 2014
- January 2014
- December 2013
- November 2013
- October 2013
- September 2013
- August 2013
- July 2013
- June 2013
- May 2013
- April 2013
- March 2013
- February 2013
- January 2013
- December 2012
- November 2012
- October 2012
- September 2012
- August 2012
- July 2012
- June 2012
- May 2012
- April 2012
- March 2012
- February 2012
- January 2012
- December 2011
- November 2011
- October 2011
- September 2011
- August 2011
- July 2011
- June 2011
- May 2011
- April 2011
- March 2011
- February 2011
- January 2011
- December 2010
- November 2010
- October 2010
- September 2010
- August 2010
- July 2010
- June 2010
- May 2010
- April 2010
- March 2010
- February 2010
- January 2010
- December 2009
- November 2009
- October 2009
- September 2009
- August 2009
- July 2009
- June 2009
- May 2009
- April 2009
- March 2009
- February 2009
- January 2009
- December 2008
- November 2008
- October 2008
- September 2008
- August 2008
- July 2008
- June 2008
- May 2008
- April 2008
- March 2008
- February 2008
- January 2008
- December 2007
- November 2007
- October 2007
- September 2007
- August 2007
- July 2007
- June 2007
- May 2007
- April 2007
- March 2007
- February 2007
- January 2007
- December 2006
- November 2006
- October 2006
- September 2006
- August 2006
- July 2006
- June 2006
- May 2006
- April 2006
- March 2006
- February 2006
- January 2006
- December 2005
- November 2005
- October 2005
- September 2005
- August 2005
- July 2005
 Eddy Elfenbein is a Washington, DC-based speaker, portfolio manager and editor of the blog Crossing Wall Street. His