-
Forecasters Turn Bullish on the Economy
Posted by Eddy Elfenbein on May 24th, 2010 at 9:57 amThere’s a new story this morning saying that the National Association for Business Economics is more optimistic on the economy.
The panel of forecasters boosted its expectations for growth in 2010 to 3.2 percent real gross domestic product, up from 3.1 percent in its February outlook. It also pegged the 2011 growth rate at 3.2 percent.
Household spending, while still lagging the overall economy, is still expected to grow significantly this year. The forecasters attribute part of that to consumers being less thrifty, with the saving rate for 2010 seen dropping to 3.4 percent from the 4.6 percent they predicted just three months ago.
Business investment also is expected to fuel the recovery. The economists expect higher operating rates and rising corporate profits boosting companies’ spending on equipment and software, while retailers restock inventory.That may sound good, but if the forecast is correct it means the jobs market still has a long way to go. For the unemployment rate to start dropping in a serious way, the economy will have to grow faster than 3% for several quarters. In fact, it would be much better if it grew by 4% to 5%.
The only silver lining is that these forecasts have a notoriously poor track record. -
S&P 500: 123 Dividend Increases to Just Two Decreases
Posted by Eddy Elfenbein on May 20th, 2010 at 3:30 pmAt the end of last year, I was asked to participate in Bespoke’s Roundtable Q&A. This was one of the questions:
What do you believe will be the dominant investing themes of 2010? What will be the biggest surprises of 2010?
Not a major theme, but I expect a new-found love for dividends. A company like GE could easily raise its dividend by 50%. I doubt many money managers will beat the SDY in 2010.Standard & Poor’s analyst Howard Silverblatt said that, in total, there have been 123 increases this year for S&P 500 companies, and just two decreases, compared with last year’s dismal environment when there were 79 increases and 63 decreases. Total dividend payments have grown by more than $9.2 billion this year, compared with a $37 billion drop last year.
“We are seeing a lot of increases,” Silverblatt said. The moves include “a lot of companies that normally increase and those that increase every couple of years, which is a good sign,” he noted.
But Silverblatt also said there are many companies that are still hesitant, in the face of economic uncertainty, to part with precious cash. European concerns have plagued the stock market in recent weeks and were managing to keep every one of the companies that raised their payouts in the past two days in the red on Thursday, likely making some wary.
And the tax rates on dividends are scheduled to climb sharply starting in 2011, making share buybacks or other alternative cash uses more attractive for some companies.
“They are waiting for actual, in-my-pocket, decent orders of my widgets,” Silverblatt said, “as opposed to just reading how great everything is in the newspaper.” -
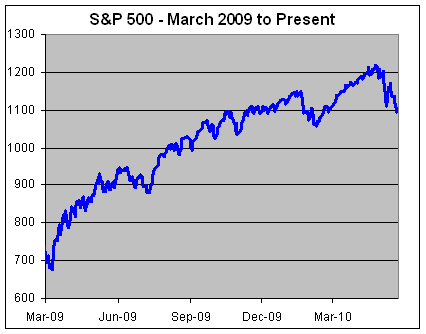
A Little Perspective
Posted by Eddy Elfenbein on May 20th, 2010 at 2:57 pmYou know how the markets are crashing today? Well, let’s take a small step back:
-
Sector Groups This Afternoon
Posted by Eddy Elfenbein on May 20th, 2010 at 2:23 pmHere’s how the different industry group ETFs are performing as of this afternoon:
Healthcare -2.33%
Staples -2.34%
Utilities -2.35%
Technology -2.68%
Discretionaires -3.21%
Financials -3.48%
Materials -3.57%
Industrials -3.76%
Energy -3.92%
Notice how closely bunched the three major defensive groups are (utes, healthcare and staples). Also, the bottom three are the major cyclical groups (materials, industrials and energy). -
Attention Income Investors
Posted by Eddy Elfenbein on May 20th, 2010 at 2:21 pmReynolds American (RAI) now yield 6.9%. I know Europeans like to smoke, but sheesh! Remember this is a company that recently beat expectations. There’s no value trap here.
-
The VIX Spikes Over 42
Posted by Eddy Elfenbein on May 20th, 2010 at 10:30 amThe Volatility Index (^VIX) is currently over 42 which is close to where it was two weeks ago during the Flash Crash. Two items are coming tomorrow. One is that it’s options expiration. The other is that the Germans are due to vote on the EU bailout. The good news is that the Buy List is holding up much better than the rest of the market.
-
Hold on Tight!
Posted by Eddy Elfenbein on May 20th, 2010 at 9:42 amWe’re getting very close to our Flash Crash low of 1065. Of the 500 stocks in the S&P 500, 490 are lower today. Once again, it’s the cyclicals that are doing the worst.
-
Yesterday’s Strategy Session
Posted by Eddy Elfenbein on May 19th, 2010 at 1:43 pmI want to thank Charles Kirk for bringing me on yesterday’s Strategy Session. In case you missed it, here it is. I also wanted to thank all the participants. It was a lot of fun!
-
Core Inflation at 44-Year Low
Posted by Eddy Elfenbein on May 19th, 2010 at 12:12 pmToday’s consumer inflation report showed that year-over-year core inflation (which excludes food and energy prices) reached a 44-year low. Over the past 12 months, core prices rose by just 0.92%.
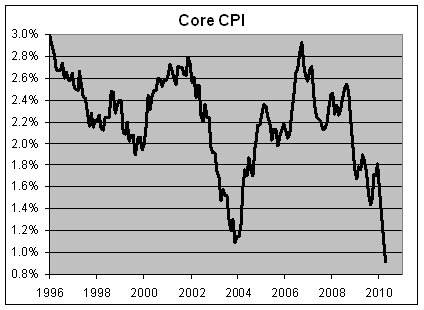
This report also broke a string of 171 straight months where the core CPI came in between 1% and 3%. -
S&P 500 Nears 200-DMA
Posted by Eddy Elfenbein on May 19th, 2010 at 11:50 amThe S&P 500 is close to its 200-day moving average. This is simply the average of the last 200 trading days.
I’ve mentioned that I’m not a terribly big fan of technical analysis. One exception is the 200DMA because it has a pretty decent track record. Here’s what I wrote last year.So does the 200DMA work? The evidence suggests that it’s a pretty good indicator of future price performance. When the S&P 500 has been below the 200DMA, it’s dropped a total of about 20% over the equivalent of 27 years. In other words, the S&P 500 has been below its 200DMA about one-third of the time.
Historically, the best time to invest has been when the S&P is less than 1.7% below the 200DMA.
When the index is above the 200DMA, well, then everything looks much brighter. All of the market’s gain and then some have happen when we’re above the 200DMA which occurs about two-thirds of the time.
The market seems to like nearly every point of being above the 200DMA. Danger only clicks in when the S&P 500 is over 17.5% above the 200DMA which is a very high reading.I think the 200DMA moving average is a good example of a dumb rule that works for smart reasons. The key is that it understands that the market is a trend-friendly data series. Once things start moving in one direction, they tend to keep moving.
- Tweets by @EddyElfenbein
-
-
Archives
- September 2024
- August 2024
- July 2024
- June 2024
- May 2024
- April 2024
- March 2024
- February 2024
- January 2024
- December 2023
- November 2023
- October 2023
- September 2023
- August 2023
- July 2023
- June 2023
- May 2023
- April 2023
- March 2023
- February 2023
- January 2023
- December 2022
- November 2022
- October 2022
- September 2022
- August 2022
- July 2022
- June 2022
- May 2022
- April 2022
- March 2022
- February 2022
- January 2022
- December 2021
- November 2021
- October 2021
- September 2021
- August 2021
- July 2021
- June 2021
- May 2021
- April 2021
- March 2021
- February 2021
- January 2021
- December 2020
- November 2020
- October 2020
- September 2020
- August 2020
- July 2020
- June 2020
- May 2020
- April 2020
- March 2020
- February 2020
- January 2020
- December 2019
- November 2019
- October 2019
- September 2019
- August 2019
- July 2019
- June 2019
- May 2019
- April 2019
- March 2019
- February 2019
- January 2019
- December 2018
- November 2018
- October 2018
- September 2018
- August 2018
- July 2018
- June 2018
- May 2018
- April 2018
- March 2018
- February 2018
- January 2018
- December 2017
- November 2017
- October 2017
- September 2017
- August 2017
- July 2017
- June 2017
- May 2017
- April 2017
- March 2017
- February 2017
- January 2017
- December 2016
- November 2016
- October 2016
- September 2016
- August 2016
- July 2016
- June 2016
- May 2016
- April 2016
- March 2016
- February 2016
- January 2016
- December 2015
- November 2015
- October 2015
- September 2015
- August 2015
- July 2015
- June 2015
- May 2015
- April 2015
- March 2015
- February 2015
- January 2015
- December 2014
- November 2014
- October 2014
- September 2014
- August 2014
- July 2014
- June 2014
- May 2014
- April 2014
- March 2014
- February 2014
- January 2014
- December 2013
- November 2013
- October 2013
- September 2013
- August 2013
- July 2013
- June 2013
- May 2013
- April 2013
- March 2013
- February 2013
- January 2013
- December 2012
- November 2012
- October 2012
- September 2012
- August 2012
- July 2012
- June 2012
- May 2012
- April 2012
- March 2012
- February 2012
- January 2012
- December 2011
- November 2011
- October 2011
- September 2011
- August 2011
- July 2011
- June 2011
- May 2011
- April 2011
- March 2011
- February 2011
- January 2011
- December 2010
- November 2010
- October 2010
- September 2010
- August 2010
- July 2010
- June 2010
- May 2010
- April 2010
- March 2010
- February 2010
- January 2010
- December 2009
- November 2009
- October 2009
- September 2009
- August 2009
- July 2009
- June 2009
- May 2009
- April 2009
- March 2009
- February 2009
- January 2009
- December 2008
- November 2008
- October 2008
- September 2008
- August 2008
- July 2008
- June 2008
- May 2008
- April 2008
- March 2008
- February 2008
- January 2008
- December 2007
- November 2007
- October 2007
- September 2007
- August 2007
- July 2007
- June 2007
- May 2007
- April 2007
- March 2007
- February 2007
- January 2007
- December 2006
- November 2006
- October 2006
- September 2006
- August 2006
- July 2006
- June 2006
- May 2006
- April 2006
- March 2006
- February 2006
- January 2006
- December 2005
- November 2005
- October 2005
- September 2005
- August 2005
- July 2005
 Eddy Elfenbein is a Washington, DC-based speaker, portfolio manager and editor of the blog Crossing Wall Street. His