-
Roubini Vs. the Market
Posted by Eddy Elfenbein on April 19th, 2010 at 3:45 pmEkonomi Turk has a clever post showing the gain in the S&P 500 is aligned with the decline in Google searches for “Dr. Doom” Professor Nouriel Roubini. Click here to see the chart.
When you look at the graph, you will notice the negative correlation especially after Summer of 2007. The graph covers Aug 2006- Apr 2010 period. The last time Roubini’s popularity increased tremendously was March 2009. Since then Roubini’s popularity has been declining and the stock market has been increasing. I also ran a regression test and found that 1 unit increase in Roubini’s popularity is associated with a 114 point decline in S&P 500 index. His popularity was 5.5 in March 2009 and it is 1 now, so this implies that S&P 500 index should increase by about 114*4.5= 513 points since March 2009. Considering that S&P 500 was around 680 when Roubini’s popularity peaked the last time, our regression tells us that S&P 500 index should be around 1200 today.
-
Apple and Goldman — Together No More
Posted by Eddy Elfenbein on April 19th, 2010 at 11:16 amFor about 18 months, the share prices of Apple (AAPL) and Goldman Sachs (GS) followed each other pretty closely (though Apple has many more shares outstanding).
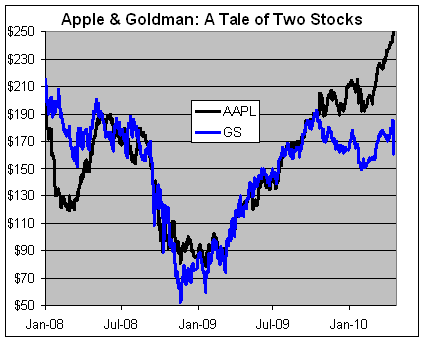
As recently as six months ago, both stocks had the same share price. Today, however, Apple’s stock is worth $85 more than Goldman. -
Is Goldman a Good Buy?
Posted by Eddy Elfenbein on April 19th, 2010 at 10:34 am
In Tom Wolfe’s The Bonfire of the Vanities, the D.A. was known as Captain Ahab for his tireless search for the Great White Defendant. I can’t help but this of this when looking at the SEC’s case against Goldman Sachs (GS). This is a very convenient target coming at a very convenient time.
If the facts we have are correct, then Goldman should clearly be found guilty before a moral court. However, the actual legal case the SEC has seems shockingly thin. Even after several months, the case will turn on the materiality of John Paulson’s role in forming the Abacus portfolio. Furthermore, Mr. Tourre isn’t merely a small fry—he’s a micro-guppy.
The Wall Street Journal opines:After 18 months of investigation, the best the government can come up with is an allegation that Goldman misled some of the world’s most sophisticated investors about a single 2007 “synthetic” collateralized debt obligation (CDO)? Far from being the smoking gun of the financial crisis, this case looks more like a water pistol.
My guess is that Goldman will end up writing a big check to make all this go away, say, about $200 million which would be around 40 cents a share for a company with a book value of $117. The damage to their reputation won’t be so easy to take care of.
Let’s look at some numbers: Goldman is probably on track to earn about $10 billion this year, give or take, which works out to around $18 a share (in their Annus mirabilis of 2007, they made close to $25 a share). Owning Goldman is almost like owning your own ATM—the cash just flies out anytime you want.
Using some mathematicification we can see that Goldman is going for around nine times earnings, and 1.4 times book value. Is that good buy? The stock is probably cheap but it’s definitely not a good buy. Looks can be deceiving. Sure, the SEC’s case may fall apart and Goldman will zoom back to $200 a share, but there are too many uncertainties to judge if that will happen. One of the most important keys to investing is to avoid any unnecessary risks. I don’t know what the SEC has up its sleeves. The agency is clearly under political pressure and they’ll do whatever they have to validate their existence. Buying Goldman now is a bet I’m not willing to take.
Being a bank is all about trust. Ultimately, that’s the product you offer your clients. The specifics of the SEC’s case are surprisingly sloppy, but the picture is very stark. Goldman was not fully honest with their clients. This will probably lead to a string or more lawsuits. Until the dust clears, there are many better buys elsewhere. -
Lilly Beats the Street
Posted by Eddy Elfenbein on April 19th, 2010 at 9:42 amThe earnings parade continues this week. The good news this morning is that one of our Buy List stocks, Eli Lilly (LLY) reported earnings of $1.18 a share which beat the Street by eight cents a share. Revenues rose by 9% to $5.49 billion.
Earlier the company said it was expect full-year EPS of $4.65 to $4.85. I always like it when companies give full-year forecasts. Today, Lilly pared that forecast back to $4.40 o $4.55 due to Medicaid-related rebates.
Here’s the CFO discussing the quarterly result. Interestingly, he notes that the company is increasing its guidance after you discount the charge:
This was another very good quarter by Lilly but I’d like to see more guidance on their pipeline.
We have a few more earnings reports coming out this week. Tomorrow will be an especially big day as Gilead Sciences (GILD), Johnson & Johnson (JNJ) and Stryker (SYK) are due to report. Then on Thursday, Baxter International (BAX) and Reynolds American (RAI) will report. -
Quote of the Day
Posted by Eddy Elfenbein on April 18th, 2010 at 11:08 pmThe following is an excerpt from John Keegan’s book The First World War describing the second day of the Battle of Artois:
In early afternoon they moved forward in ten columns ‘each [of] about a thousand men, all advancing as if carrying out a parade-ground drill.’ The German defenders were astounded by the sight of an ‘entire front covered with the [British] infantry.’ They stood up, some even on the parapet of the trench, and fired triumphantly into the mass of men advancing across the open grassland. The machine gunners had opened fire at 1,500 yards range. ‘Never had machine guns had such straightforward work to do … with barrels becoming hot and swimming in oil, they traversed to and fro along the [British] ranks; one machine gun alone fired 12,500 rounds that afternoon. The effect was devastating. The [British] could be seen falling literally in hundreds, but they continued their march in good order and without interruption’ until they reached the unbroken wire of the German’s second position: ‘Confronted by this impenetrable obstacle the survivors turned and began to retire.’
The survivors were a bare majority of those who had come forward. Of the 15,000 infantry of the 21st and 24th Divisions, over 8,000 had been killed or wounded. Their German enemies, nauseated by the spectacle of the ‘corpse field of Loos,’ held their fire as the British turned in retreat, ‘so great was the feeling of compassion and mercy after such a victory.’ -
The Lack of Bad News Could Be…Bad News
Posted by Eddy Elfenbein on April 17th, 2010 at 8:31 pmWe’re still early in fourth-quarter earnings season and Wall Street has already had a nice rally this year. The S&P 500 put on nearly 15% between February 8 and this past Thursday. We could be headed for a cooling off period. Paul J. Lim notes in the New York Times that the market may be getting a tad too optimistic about earnings.
John Butters, an earnings analyst at Thomson Reuters, noted that more often than not, companies that are likely to fall short tend to pre-announce their results, in part to lower the market’s expectations.
Historically, two companies pre-announce bad news for every company that hints at better-than-expected results to come. But at the moment, Mr. Butters said, the ratio is just 1.1 to 1 — which means that far fewer companies than usual are preparing the market for disappointment.
That may sound like a positive sign, but it isn’t. Oddly, when the pre-announcement ratio has been this low over the last decade, it “corresponds with a decline of about 6 percent in the S.& P. 500 during the earnings season,” Mr. Kleintop said. It may be that without an early warning of trouble, investors become too ebullient, leading to market declines later.Here’s a look at the S&P 500 along with its earnings. The S&P 500 is the black line and it follows the left scale. The earnings are the yellow line and they follow the right scale. The two lines are scaled at a ratio of 16-to-1, so whenever the lines cross, the P/E Ratio is exactly 16.
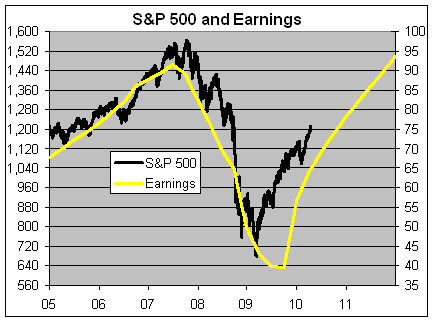
The future earnings are, of course, just a forecast. Be careful not to read too much in this chart. The point I want to show you is that the market has rallied and it’s been due to a surge in earnings that’s expected to continue.
If that yellow lines continues its sharp upward trend, then the market is still very cheap and we have nothing to worry about. We ought to assume that the black and yellow lines will converge over time.
The hitch is that this is all predicated on a very strong earnings environment. We shall know more when we’re a little older. -
Goldman, the SEC and a Whiteboard
Posted by Eddy Elfenbein on April 17th, 2010 at 3:17 pmPaddy Hirsch of Marketplace explains L’affaire Tourre.
-
Lies, Damn Lies and Government Statistics
Posted by Eddy Elfenbein on April 17th, 2010 at 2:24 pmWall Street is a place that runs on numbers. But, as Carl Bialik explains in his most recent column, the numbers that we get from the government are far fuzzier than many people realize.
For example, when the government tells us how many jobs were created or lost last month, it’s really just an estimate—and a very broad estimate at that. The most recent report said that 134,000 jobs were lost during February, but the Bureau of Labor Statistics really only says that it’s 90% confidence that actual number was somewhere between a loss of 500,000 and a gain of 200,000. That’s an enormous spread.
A lot of people like to blame the government or cite a political agenda. Sure, that’s certainly there, but even without it, collecting economic stats is a tricky business. The national economy consists of millions and millions of people making many decisions every day. It’s hard to boil down something so complex to just a few hard numbers.
There’s another issue of the government making countless revisions to its data. The GDP growth figure for the third quarter of 1983 has been revised ten times since it first came out. The most recent revision was just a few months ago.
This is why the data I like to rely most is price data from the markets—stock prices, bond yields, spreads and commodity prices. Of course, marker prices have their own biases as well.
When you face the fact that so much time and energy goes into debating the economy, and truthfully we can’t say what it’s doing with a high degree of confidence, it’s rather disquieting. Imagine watching a football game and neither you nor anyone else has any idea what the score it. That’s a lot of economics. -
Friday Is Here
Posted by Eddy Elfenbein on April 16th, 2010 at 4:41 pmOK, folks. I’ve had enough of Goldman Sachs, the SEC and CDOs for one day. The market is closed, the weather is great outside, time to enjoy the day.
Who else but the Boss can cure your Friday blues?
-
G-Day Sell-Off
Posted by Eddy Elfenbein on April 16th, 2010 at 4:34 pmOverall, I have to say that I’m not terribly impressed with the SEC’s case against Goldman Sachs (GS). Perhaps there’s more to it, but it seems pretty weak to me. My guess is that Goldman will eventually write a $200 million check to the feds, maybe less. To add some perspective, GS lost about $12 billion in market cap today. That could buy the New York Times (NYT) more than six times over.
Today was another good day for the Buy List. By that, I mean we did less worse than the rest of the market. The S&P 500 dropped below 1,200 to close at 1192.13 for a loss of -1.61%. The 20 stocks on the Buy List lost an average of 0.91%. That’s a very nice outperformance for one day. For the year, the Buy List is up 13.05% (not including dividends) compared with the S&P 500’s gain of just 6.91%.
Nicholas Financial (NICK) got to another new high of $8.67 although it closed down slightly. Of our 20 stocks, only Gilead Sciences (GILD) and Wright Express (WXS) were up today. Wright had been one of our laggards but it woke up this past week. The stock is at a new 52-week and it’s due to report earnings on April 27. Here’s a list of some of our upcoming earnings reports.
- Tweets by @EddyElfenbein
-
-
Archives
- September 2024
- August 2024
- July 2024
- June 2024
- May 2024
- April 2024
- March 2024
- February 2024
- January 2024
- December 2023
- November 2023
- October 2023
- September 2023
- August 2023
- July 2023
- June 2023
- May 2023
- April 2023
- March 2023
- February 2023
- January 2023
- December 2022
- November 2022
- October 2022
- September 2022
- August 2022
- July 2022
- June 2022
- May 2022
- April 2022
- March 2022
- February 2022
- January 2022
- December 2021
- November 2021
- October 2021
- September 2021
- August 2021
- July 2021
- June 2021
- May 2021
- April 2021
- March 2021
- February 2021
- January 2021
- December 2020
- November 2020
- October 2020
- September 2020
- August 2020
- July 2020
- June 2020
- May 2020
- April 2020
- March 2020
- February 2020
- January 2020
- December 2019
- November 2019
- October 2019
- September 2019
- August 2019
- July 2019
- June 2019
- May 2019
- April 2019
- March 2019
- February 2019
- January 2019
- December 2018
- November 2018
- October 2018
- September 2018
- August 2018
- July 2018
- June 2018
- May 2018
- April 2018
- March 2018
- February 2018
- January 2018
- December 2017
- November 2017
- October 2017
- September 2017
- August 2017
- July 2017
- June 2017
- May 2017
- April 2017
- March 2017
- February 2017
- January 2017
- December 2016
- November 2016
- October 2016
- September 2016
- August 2016
- July 2016
- June 2016
- May 2016
- April 2016
- March 2016
- February 2016
- January 2016
- December 2015
- November 2015
- October 2015
- September 2015
- August 2015
- July 2015
- June 2015
- May 2015
- April 2015
- March 2015
- February 2015
- January 2015
- December 2014
- November 2014
- October 2014
- September 2014
- August 2014
- July 2014
- June 2014
- May 2014
- April 2014
- March 2014
- February 2014
- January 2014
- December 2013
- November 2013
- October 2013
- September 2013
- August 2013
- July 2013
- June 2013
- May 2013
- April 2013
- March 2013
- February 2013
- January 2013
- December 2012
- November 2012
- October 2012
- September 2012
- August 2012
- July 2012
- June 2012
- May 2012
- April 2012
- March 2012
- February 2012
- January 2012
- December 2011
- November 2011
- October 2011
- September 2011
- August 2011
- July 2011
- June 2011
- May 2011
- April 2011
- March 2011
- February 2011
- January 2011
- December 2010
- November 2010
- October 2010
- September 2010
- August 2010
- July 2010
- June 2010
- May 2010
- April 2010
- March 2010
- February 2010
- January 2010
- December 2009
- November 2009
- October 2009
- September 2009
- August 2009
- July 2009
- June 2009
- May 2009
- April 2009
- March 2009
- February 2009
- January 2009
- December 2008
- November 2008
- October 2008
- September 2008
- August 2008
- July 2008
- June 2008
- May 2008
- April 2008
- March 2008
- February 2008
- January 2008
- December 2007
- November 2007
- October 2007
- September 2007
- August 2007
- July 2007
- June 2007
- May 2007
- April 2007
- March 2007
- February 2007
- January 2007
- December 2006
- November 2006
- October 2006
- September 2006
- August 2006
- July 2006
- June 2006
- May 2006
- April 2006
- March 2006
- February 2006
- January 2006
- December 2005
- November 2005
- October 2005
- September 2005
- August 2005
- July 2005
 Eddy Elfenbein is a Washington, DC-based speaker, portfolio manager and editor of the blog Crossing Wall Street. His