-
Oopsie!
Posted by Eddy Elfenbein on February 6th, 2010 at 3:45 pmThere was a confusing story but apparently 1 million people lost their jobs yesterday.
No wait, that’s not it. It turns out that the government reported that 1 million people lost their jobs yesterday.
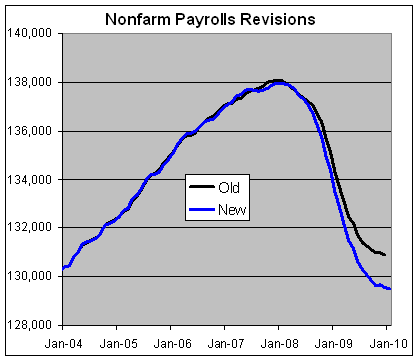
No wait, that’s not it either. The government updated their jobs stats yesterday for the last six years and it turns out the Labor Department was off by 1 million.
And for this, no one in the Labor Department lost their job.
-
Odd Lots
Posted by Eddy Elfenbein on February 6th, 2010 at 1:42 pmThe snow is still coming down in Washington. We’re well over eighteen inches now. The snow started coming down about 11 am yesterday and is expected to stop sometime tonight.
Since I’m snowbound, here are a few links to pass on:
Football games have 11 minutes of action.
Not sure what this is, but it’s cool.
So it turns out Blankfein’s bonus wasn’t $100 million, just $9 million.
Arnold Kling and Nick Schulz at Cato.
Fresno tops list of ‘drunkest’ cities in America
What are the odds of a cow making it to the Super Bowl?
Barry Ritholtz on the economics of book writing.
Gen Y too lazy and unfocused to hire
Moe Tkacik on credit crisis literature. -
Update on Turn-of-the-Month Investing
Posted by Eddy Elfenbein on February 4th, 2010 at 10:00 pmA few of you asked if the turn-of-the-month gains were mainly caused by the turn of the year. It turns out that January is the big winner, but other months also did very well.
Here are the average gains for each seven-day turn-of-the-month period (the month listed is the month being turned to):
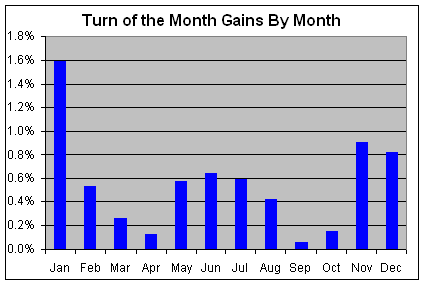
Here are the numbers:Month Avg Gain Jan 1.59% Feb 0.54% Mar 0.27% Apr 0.14% May 0.58% Jun 0.65% Jul 0.60% Aug 0.43% Sep 0.07% Oct 0.16% Nov 0.91% Dec 0.82% -
Earnings Update
Posted by Eddy Elfenbein on February 4th, 2010 at 8:21 pmHere’s a quick note on the latest earnings forecasts from S&P. For 2009, it looks like the S&P 500 will earn $57.03 a share. A year ago, Goldman Sachs cut its 2009 EPS forecast from $53 to $40.
S&P’s current forecast for 2010 EPS is $77.94. That means that the market is currently going for 13.6 times this year’s earnings. If you compare that to AAA bond yields which are averaging about 5.3% now, I think stocks look very good here. -
Los Angeles 1781 – 2010
Posted by Eddy Elfenbein on February 4th, 2010 at 1:01 pmAfter struggling for eight hours to counter a rapidly growing budget shortfall, the Los Angeles City Council put off a decision to cut 1,000 jobs Wednesday and, through other actions, managed to add $4 million to the problem.
Unable to take more straightforward action on a shortfall that has grown to $212 million this year, the council voted to seek another list of possible job cuts and, after hearing pleas from a chamber packed with protesting employees and residents, promised not to act on layoffs for 30 days.
Members also postponed the elimination of three city departments as they search for new sources of revenue, including uncollected debts and federal stimulus funds.
Council leaders had hoped to strike a compromise between the group’s budget hawks, who have been calling for layoffs for more than a week, and the doves who sought to save the jobs of civilian employees. But Councilmen Greig Smith and Bernard C. Parks, who favored the job cuts, said the series of votes had only added to the crisis. -
Back to 1070
Posted by Eddy Elfenbein on February 4th, 2010 at 10:40 amThe S&P 500 is back to where it was late Friday, around the 1070 to 1075 area. This also puts us back to where we were about two months ago. Personally, I want to see the market pull back because I’m in a buying mood. I’ve also been very pleased with Nicholas Financial‘s (NICK) positive response to its earnings. The last two days have seen heavy volume.
Also, Reynolds American (RAI) had an awful earnings report, but don’t worry about it. I was expecting bad news. That’s why the stock is so cheap. The important news is that they’re forecasting $4.80 to $5.00 per share. If that forecasts holds up, RAI should be much higher by the end of the year. -
Seven Days Each Month Beats the Market — By a Lot
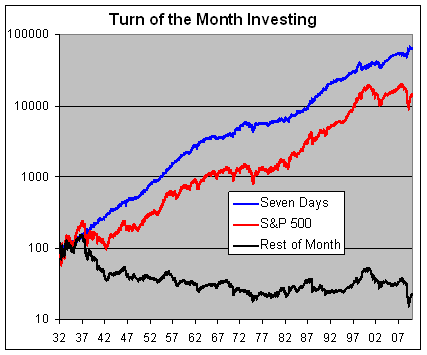
Posted by Eddy Elfenbein on February 4th, 2010 at 7:03 amSince 1932, most of the S&P 500’s capital gain has come during a seven-day period at the turn of each month—specifically, the last four trading days and the first three trading days of each month. This represents about one-third of the total trading days. During the rest of the month, the stock market actually lost money.
Here are the numbers: Since the beginning of 1932, the S&P 500 has gained nearly 14,000% which is about 6.5% annualized. Investing in just the last four days and first three days of each month would have returned over 63,000% (not including trading costs). Annualized, that’s 8.6%. However, if you consider that it’s really only 32% of the time, the true annualized rate is over 28%.
The rest of the month — the other 68% of the time — has resulted in a combined loss of close to 78%.
Let me add some important caveats. First, I’m not offering this as trading advice. I’m merely showing that the market has historically experienced outsized gains at the turn of each month. Remember that trading in and out of the market is costly and these results don’t include taxes or commissions.
Secondly, this only refers to capital gains not dividends. A very large part of the market’s total return is due to dividends, and if you’re only invested one-third of the time, you’re going to lose out.
Having said that, here’s a graph showing what turn-of-the-month investing looks like. The S&P 500 is the red line. The blue line is performance during the seven-day period and the rest of the month is the black line.
Here’s a look at the average daily gains.
Day Daily Gain Stand Dev Fourth to Last 0.068% 1.064% Third to Last 0.021% 1.055% Second to Last 0.071% 1.037% Last 0.088% 0.997% First 0.118% 1.117% Second 0.168% 1.065% Third 0.155% 1.077% Why has the market shown this performance? It’s hard to say. One idea is that we’re seeing a pattern that’s simply the result of random behavior. If you splice and dice any data long enough, you’re bound to find some anomaly.
My hunch, however, is that there’s something to the turn-of-the-month effect. Perhaps it’s new money coming in or maybe positive business news is more likely to be announced.
Still, as powerful as the historical data is, I think the effect is too transient to base any investment strategy on.
-
Good Earnings for AFLAC and Fiserv
Posted by Eddy Elfenbein on February 3rd, 2010 at 6:37 amIn October, AFLAC (AFL) said to expect Q4 EPS between $1.08 and $1.16. Well…they made $1.18 a share which was three cents higher than the Street.
For the full year, the company earned $1.5 billion, or $3.19 per share, compared with profit of $1.25 billion, or $2.62 per share, during the same period a year prior. Revenue rose to $18.25 billion from $16.55 billion.
The company expects profit growth in 2010 to between $5.24 and $5.56 per share. Analysts expect profit of $5.29 per share.
Also, the company said its board of directors declared the first quarter cash dividend of 28 cents per share, which is payable March 1 to shareholders of record at the close of business on Feb. 16.Going by the company’s projection, the stock is going for about 9.0 to 9.5 times this year’s earnings.
One other thing to note: AFLAC announced a Q1 dividend of 28 cents a share which is what it’s been for all of 2009. I believe AFLAC has the longest current streak of double-digit dividend increases. I can’t be positive, but I’ve looked hard and I haven’t found anyone who’s done it longer. Since the year isn’t over, the streak hasn’t been snapped just yet, but I hope the board keeps the streak going. If the board raises the dividend to 32 cents for the next three quarters, then the streak will live on.
Also, Fiserv‘s (FISV) earnings were in line:Fiserv Inc.’s (FISV) fourth-quarter earnings soared 90% as it shed prior-year charges and revenue rose slightly.
Chief Executive Jeffrey Yabuki called the period strong, adding that record December sales helped drive growth in sales, which topped expectations, helping push shares up 1.3%, to $47 in after-hours trading.
For 2010, the company expects earnings of $3.96 to $4.07 a share, bracketing Wall Street’s average estimate of $4.05, according to Thomson Reuters.
Fiserv provides information technology to the financial and insurance industries. It offers services that include electronically posting checks, opening accounts and tracking loans. The company has previously been able to generate stable revenue despite continuing economic pressure on the financial sector.
Fiserv reported earnings of $118 million, or 76 cents a share, up from $62 million, or 39 cents a share, a year earlier. Earnings from continuing operations, excluding integration costs and other items, rose to 94 cents from 89 cents. Revenue climbed 2.1%, to $1.06 billion.
Analysts polled by Thomson Reuters expected earnings of 94 cents with revenue of $1.04 billion.
Excluding items, operating margin fell to 28.1% from 30.1%.I like companies that make projections for the year ahead. Like AFLAC, Fiserv is going for a reasonable price based on next year’s earnings.
-
The Very Long View
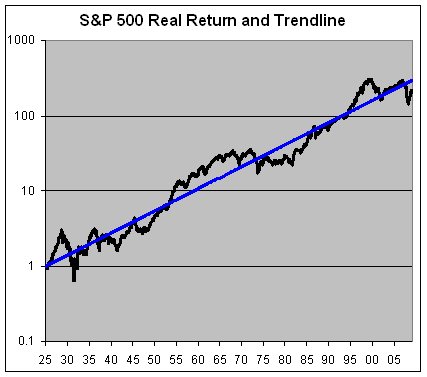
Posted by Eddy Elfenbein on February 2nd, 2010 at 11:41 pmOver the last 84 years, the after-inflation return of the stock market (including dividends) has been about 6.6% a year. Historically, that number has been about 7%, but thanks to recent years it’s come down a lot.
What this means is that, on average, stock investors have doubled their money in real terms every 11 years. Of course, that’s an average. Over the last 11 years, the stock market hasn’t made any money in real terms.
Here’s a look at the inflation-adjusted total return along with a 7% trendline:
Here’s a look at the same chart, but I divided the black line by the blue line.
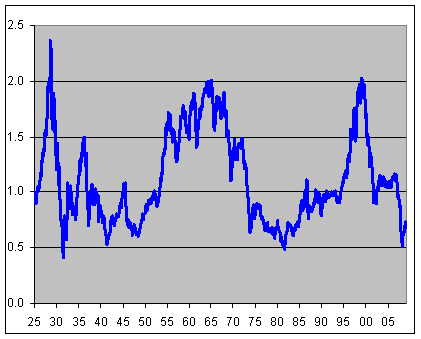
In other, this shows how the market is doing relative to its long-term trend. Interestingly, there are long stretches where this line looks somewhat similar to a P/E Ratio graph which shouldn’t be that surprising.
Looking at this chart, you can really see how poorly the stock market has done over the past decade. I also think it’s interesting that the peaks and troughs seem to line up at 2.0 and 0.5, but I may be seeing a connection where there isn’t one. -
An Historical Look at the Budget
Posted by Eddy Elfenbein on February 2nd, 2010 at 5:18 pmHere’s a look at the Federal government’s receipts (red) and outlays (blue) as a percent of GDP. I got these numbers from the president’s budget. The numbers after 2009 are forecasts.
I broke the outlays into defense (green) and non-defense (black).
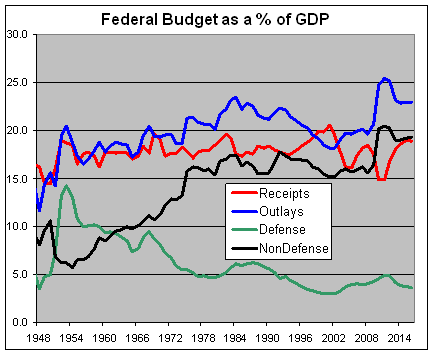
A few observations.
It’s stunning how far defense spending has fallen. In 1958, over 10% of the economy went to the Pentagon and that was for a peacetime military. Before 9/11, it had dropped to just 3%. Even with two wars, we’re only back to 4.6% which is less than what Reagan defense buildup wanted to build up from. I wouldn’t be surprised to see us under 3% in another 10 years.
From 1951 through 2008, budget receipts (the red line) averaged slightly over 18%, but what’s fascinating is how consistent that was. For the entire time period, the standard deviation was under 1%. Perhaps we ought to take nearly six decades of data as a hint, and aim to raise that much every year. Obama plans to keep up within the historical norm. His forecast goes to 18.6% by 2014 and 19% by 2015. Of course, he may be long gone by then.
From 1975 through 2008, nondefense spending made up an average of 16.25% of GDP with a standard deviation of less than 0.7%. But this is where Obama really becomes an outlier. This year’s non-defense spending will jump to 20.1% of GDP which is twice its share of 45 years ago.
- Tweets by @EddyElfenbein
-
-
Archives
- September 2024
- August 2024
- July 2024
- June 2024
- May 2024
- April 2024
- March 2024
- February 2024
- January 2024
- December 2023
- November 2023
- October 2023
- September 2023
- August 2023
- July 2023
- June 2023
- May 2023
- April 2023
- March 2023
- February 2023
- January 2023
- December 2022
- November 2022
- October 2022
- September 2022
- August 2022
- July 2022
- June 2022
- May 2022
- April 2022
- March 2022
- February 2022
- January 2022
- December 2021
- November 2021
- October 2021
- September 2021
- August 2021
- July 2021
- June 2021
- May 2021
- April 2021
- March 2021
- February 2021
- January 2021
- December 2020
- November 2020
- October 2020
- September 2020
- August 2020
- July 2020
- June 2020
- May 2020
- April 2020
- March 2020
- February 2020
- January 2020
- December 2019
- November 2019
- October 2019
- September 2019
- August 2019
- July 2019
- June 2019
- May 2019
- April 2019
- March 2019
- February 2019
- January 2019
- December 2018
- November 2018
- October 2018
- September 2018
- August 2018
- July 2018
- June 2018
- May 2018
- April 2018
- March 2018
- February 2018
- January 2018
- December 2017
- November 2017
- October 2017
- September 2017
- August 2017
- July 2017
- June 2017
- May 2017
- April 2017
- March 2017
- February 2017
- January 2017
- December 2016
- November 2016
- October 2016
- September 2016
- August 2016
- July 2016
- June 2016
- May 2016
- April 2016
- March 2016
- February 2016
- January 2016
- December 2015
- November 2015
- October 2015
- September 2015
- August 2015
- July 2015
- June 2015
- May 2015
- April 2015
- March 2015
- February 2015
- January 2015
- December 2014
- November 2014
- October 2014
- September 2014
- August 2014
- July 2014
- June 2014
- May 2014
- April 2014
- March 2014
- February 2014
- January 2014
- December 2013
- November 2013
- October 2013
- September 2013
- August 2013
- July 2013
- June 2013
- May 2013
- April 2013
- March 2013
- February 2013
- January 2013
- December 2012
- November 2012
- October 2012
- September 2012
- August 2012
- July 2012
- June 2012
- May 2012
- April 2012
- March 2012
- February 2012
- January 2012
- December 2011
- November 2011
- October 2011
- September 2011
- August 2011
- July 2011
- June 2011
- May 2011
- April 2011
- March 2011
- February 2011
- January 2011
- December 2010
- November 2010
- October 2010
- September 2010
- August 2010
- July 2010
- June 2010
- May 2010
- April 2010
- March 2010
- February 2010
- January 2010
- December 2009
- November 2009
- October 2009
- September 2009
- August 2009
- July 2009
- June 2009
- May 2009
- April 2009
- March 2009
- February 2009
- January 2009
- December 2008
- November 2008
- October 2008
- September 2008
- August 2008
- July 2008
- June 2008
- May 2008
- April 2008
- March 2008
- February 2008
- January 2008
- December 2007
- November 2007
- October 2007
- September 2007
- August 2007
- July 2007
- June 2007
- May 2007
- April 2007
- March 2007
- February 2007
- January 2007
- December 2006
- November 2006
- October 2006
- September 2006
- August 2006
- July 2006
- June 2006
- May 2006
- April 2006
- March 2006
- February 2006
- January 2006
- December 2005
- November 2005
- October 2005
- September 2005
- August 2005
- July 2005
 Eddy Elfenbein is a Washington, DC-based speaker, portfolio manager and editor of the blog Crossing Wall Street. His