-
Relative Performance and the Yield Curve
Posted by Eddy Elfenbein on December 31st, 2007 at 3:58 pmHere’s an interesting graph, but it needs a bit of explanation.
It’s the relative strength of each S&P 500 industry group relative to the yield spread. The horizontal axis shows the difference between the three-month and 10-year Treasury yield. The far left of the graph shows an inverted yield curve of 1%. As the graphs moves to the far right, the yield curve steepens to 4%.
Two items to mention. First, I used data going back to 1989. Also, I wanted a clean logarithmic graph so I adjusted the starting relative strength number to three. That doesn’t change the scale of the results but I wanted to make that point clear.
If you don’t mind me patting myself on the back, I think this is a fascinating chart. For example, you can see that tech stocks (the green line) do well as the yield curve becomes steeper, however, they run out of breath at the very steepest part. Materials stocks (royal blue), on the other hand, do their best at the steepest part of the yield curve.
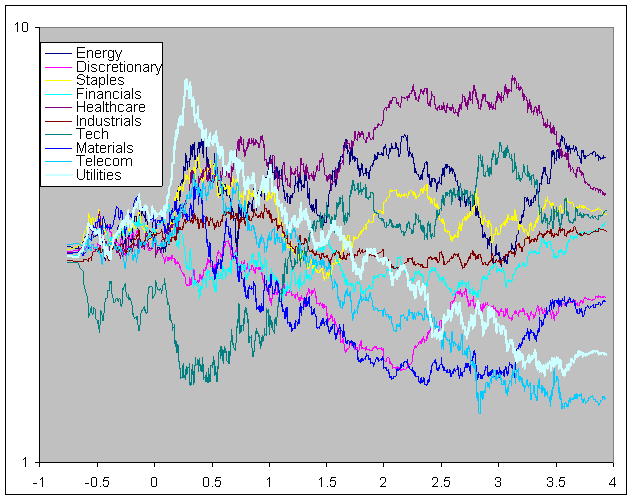
You can also see that Utilities (white) do the best when the yield curve flattens out. This is obviously due to their high dividend yields. What I find most surprising is that financial stocks seem to be of the least impacted by movements in the yield curve.
So what does it mean? In 2007, the yield curve started off negative. When the market broke in late February, the spread stood at -0.50. The spread has gradually gotten wider ever since, meaning we’ve moved from left to right. By May, the spread finally turned positive. There was a retrenchment over the summer before the spread shot to over 1.6 in August. The spread currently stands at about 0.9. Here’s a look at the yield spread over the last three years:
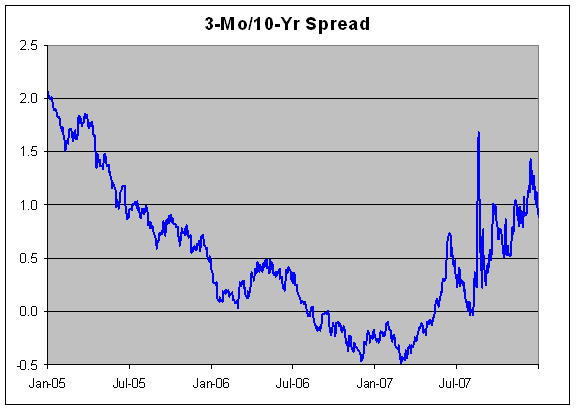
Since September, the Fed has cut short-term rates by 1%. If the Fed keeps cutting rates, the spread could reach 2.0 next year. From the first graph, that bodes well for health care (purple) and staples (yellow)—and the 2008 Buy List.
-
Top 10 Pieces of Happy Economic News
Posted by Eddy Elfenbein on December 31st, 2007 at 1:39 pmAt Bloomberg, Kevin Hassett lists the good stories about the economy:
1) Equity markets posted solid gains and price multiples are still low. As of last Friday morning, the Dow Jones Industrial Average had gained about 7 percent for the year, while yielding about 2.25 percent, providing investors with a total return of more than 9 percent. The Nasdaq Composite Index had climbed more than 10 percent, while the Standard & Poor’s 500 Index had provided a total return in the 5.5 percent range. There are no signs of irrational exuberance. The price-to- earnings ratio for the S&P 500, for example, finished the year at less than 19, safely nestled in the historical comfort range.
2) Households are wealthier. In part because of rising equity markets, household net worth increased in 2007, according to the latest numbers from the Federal Reserve. At the start of the year, net worth was $56.1 trillion. By the third quarter, this climbed to $58.6 trillion and probably rose again in the fourth quarter. If changes in wealth affect the economy through consumption, then the affect will be favorable.
3) Congress did nothing. Gridlock has historically been good for the U.S. economy for a simple reason: New laws are invariably worse than the ones they replace. Witness Sarbanes- Oxley. With the Democrats taking control of Congress, there was a real risk that taxes, in particular, would be increased. With the economy softening already, it is great news that this didn’t happen.
4) The Federal Reserve did something. From interest rate reductions to the introduction of a new auction mechanism to get needed reserves to struggling banks, the Fed has responded to the weakening economy with multiple policy moves. Thus, we have learned that Ben Bernanke’s Fed will likely be a competent actor should things get worse. This is good news for nervous markets, though there was no guarantee this would be the case. The Fed did, after all, aggravate — and may have caused — the Great Depression.
5) The world economy had another blow-out year. According to the latest Moody’s Economy.com forecast, world gross domestic product grew by 3.9 percent in 2007 after rising 3.6 percent in 2006. In spite of the gloom in the headlines, the most important news in 2007 was that economic freedom is spreading, and the benefits to the world’s citizens of this are skyrocketing.
6) The trade deficit declined. As our trading partners become wealthier, they demand more of our products. At the same time, the weaker dollar has made U.S. exports cheaper. Exports have boomed, and the real trade deficit has narrowed, from $624.4 billion in 2006 to an estimated $562.4 billion in 2007.
7) Even in the face of the housing-market bust, economic growth was solid. If someone told me last December that construction of single-family homes would drop in 2007 by 27 percent, about the current estimate from Economy.com, then I would have expected the economy to be in recession. But a collapse of that scale did occur, and annual GDP growth, according to the latest Economy.com estimate, was about 2.5 percent. There are plenty of developed countries that would take that type of growth every year.
8) Job creation was robust. According to the latest jobs report, which covers data through November, the U.S. economy added 1.3 million jobs on net in 2007. The unemployment rate was 4.6 percent in January, and finished the year a smidgen higher at 4.7 percent. Both levels are very low by historical standards.
9) The federal budget deficit declined. According to the Congressional Budget Office’s monthly budget review, the federal budget deficit was only $163 billion for fiscal 2007, a large decline from the $248 billion deficit in 2006. This decline was actually bigger than had been forecast by the CBO last January.
10) Inflation risk is low. Although energy prices surged, core inflation was up only 2.3 percent for the year ended in November, about half a percentage point lower than it was in late 2006. This is great news, making it relatively riskless for the Fed to cut interest rates next year if there are more signs of trouble. -
The Fall of Blackstone
Posted by Eddy Elfenbein on December 31st, 2007 at 1:23 pmPoor Stephen Schwarzman. Just six months ago, the Blackstone Group (BX) started trading at $36.45, a 17% premium to its IPO price. Today, the stock is down to $21.70.
-
Earnings Preview: Bed Bath & Beyond
Posted by Eddy Elfenbein on December 31st, 2007 at 11:18 amToday’s the last day of trading for 2007. The market is closed tomorrow. On Thursday, Bed Beth & Beyond will report its Q3 earnings. Here’s a preview from the AP:
OVERVIEW: Home furnishing retailers have suffered as a downturn in the housing market and softer consumer spending take a toll on sales and growth.
Consumers are being pressured to curb discretionary spending due to high food and gas prices and persistent credit problems. Bed Bath & Beyond has been a standout in the sector, however, as it focuses on middle- to high-income consumers which are less affected by the weak retail environment.
The company announced a $1 billion buyback program in September.
BY THE NUMBERS: Analysts polled by Thomson Financial expect a profit of 52 cents per share on revenue of $1.77 billion.
ANALYST TAKE: “Bed Bath & Beyond’s biggest challenge is perhaps living up to its past success,” wrote Deutsche Bank analyst Mike Baker in a Dec. 19 note to investors. “This includes generating among the highest operating margin and return on capital in hardline retailing and driving sales per foot substantially ahead of competitors.”
He rates the company “Hold.”
He added that the company has healthy square-footage growth and cash flow, but its operating margin is being squeezed as competitors offer promotions and same-store sales growth slows. -
The View from the Top
Posted by Eddy Elfenbein on December 31st, 2007 at 9:08 amI went to yesterday’s Redskin’s game. I was in the second-to-the-last row which, at FedEx Field, is really, REALLY high up. As least I can say I had a seat on the 50-yard line.
Yesterday’s attendance was an all-time FedEx record of 90,910. Here’s a blurry view:

Those little dots on the field are the players. It was cold, wet and miserable. I had a blast and best of all, we’re going to the playoffs. -
Moog (MOG-A)
Posted by Eddy Elfenbein on December 29th, 2007 at 7:02 amI’m pleased to announce that Moog (MOG-A) will be final stock on the 2008 Buy List. This late addition is to replace Respironics (RESP) which recently announced that it’s being bought out.
I’ll start tracking the 20 stocks of the 2008 Buy List on Wednesday, January 2 which will be the first day of trading of the new year. Once trading begins, I can’t make any changes for the rest of the year.
Here’s a description of Moog from Hoovers:Moog (rhymes with “rogue”) rules with its precision-control components and systems used in aerospace products, industrial machinery, and medical equipment. Servoactuators, Moog’s core product, receive electrical signals from computers and then perform specific actions. Using its servoactuators, Moog builds flight and control systems for commercial and military aircraft, hydraulic and electrical controls for plastic-injection and blow-molding machines, and control systems for satellites and spacecraft. The company also makes electric motors for sleep apnea equipment. Employees hold about 60% of Moog through stock ownership and retirement plans.
Here’s a look at the growth of Moog’s earnings-per-share:
Year………..EPS
1997………..$0.56
1998………..$0.67
1999………..$0.80
2000………..$0.84
2001………..$0.94
2002………..$1.11
2003………..$1.22
2004………..$1.45
2005………..$1.64
2006………..$1.97
2007………..$2.34
2008………..$2.72 (estimate)
2009………..$3.16 (estimate)
Pretty solid.
Here once again is the 2008 Buy List:
AFLAC (AFL)
Amphenol (APH)
Bed Bath & Beyond (BBBY)
Clarcor (CLC)
Donaldson (DCI)
Danaher (DHR)
FactSet Research Systems (FDS)
Fiserv (FISV)
Harley-Davidson (HOG)
Jos. A Bank Clothiers (JOSB)
Leucadia National (LUK)
Lincare (LNCR)
Medtronic (MDT)
Nicholas Financial (NICK)
Moog (MOG-A)
SEI Investments (SEIC)
Stryker (SYK)
Sysco (SYY)
UnitedHealth Group (UNH)
WR Berkley (BER) -
Dividends Continue to Rise
Posted by Eddy Elfenbein on December 28th, 2007 at 8:27 pmI often hear market bears describe the current market as “a bubble.” What I find interesting is that if this is a bubble, it’s got to be one of the few bubbles where stock prices have generally lagged growth in both earnings and dividends.
S&P just reported that dividends for the S&P 500 grew by 11.5% over last year. They’re also projecting a 9.3% growth for next year. This means that in the last four years, dividends have grown by 60%.
The overall dividend rate is still very low—less than 2%. But don’t overestimate how quickly these payments can add up. Over the last five-and-a-half years, dividends have contributed about 10% to the overall return of the S&P 500. That’s around 1,300 Dow points.
S&P also added five new stocks to its list of Dividend Aristocrats. These are companies that have increased their dividend every year for the last 25 years. The stocks are Avery Dennison, Exxon Mobil, Integrys Energy, Pitney Bowes and our very own AFLAC (AFL).
Here’s a complete list of Dividend Aristocrats. There’s also an ETF for the Dividend Aristocrats, symbol SDY. -
Projected Earnings Growth
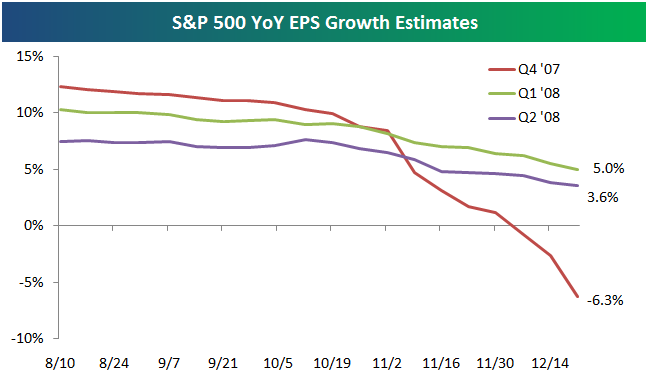
Posted by Eddy Elfenbein on December 27th, 2007 at 3:46 pmThe lads at Bespoke Investment Group have tracked projected earnings growth for the S&P 500. Or I should say, lack of growth. For Q4, analysts now expect a decline of 6.3%. In August, analysts were expecting 12.3% growth.
Q1 has been pared back to 5% growth and Q2 is now at 3.6%.
-
NICK Under $7 a Share
Posted by Eddy Elfenbein on December 27th, 2007 at 1:43 pmI hope to have more about this sometime soon, but gosh darn it—Nicholas Financial (NICK) is cheap. The stock is priced as if it’s going out of business. NICK is currently priced well below book value which is $7.30 a share. Last quarter, NICK made 25 cents a share, and it made 27 cents in the quarter before that.
We’ll find out more when the company reports its third-quarter earnings next month. I think it’s very reasonable to assume that NICK will make $1 a share for this fiscal year. That means the P/E ratio is under 7. -
10-Year-Old Cramer
Posted by Eddy Elfenbein on December 26th, 2007 at 9:06 pmWatch out, Jim. He’s got your game.
- Load More
Does anyone have a suit of armor, jet skis and a blowtorch I can borrow/rent? There's an experiment I'm working on.
This is pretty amazing. US elections combined since 1924:
GOP: 1,058,301,749
DEM: 1,057,846,951
Oth: 88,548,252Unemployment spikes in Washington, DC
-
-
Archives
- April 2025
- March 2025
- February 2025
- January 2025
- December 2024
- November 2024
- October 2024
- September 2024
- August 2024
- July 2024
- June 2024
- May 2024
- April 2024
- March 2024
- February 2024
- January 2024
- December 2023
- November 2023
- October 2023
- September 2023
- August 2023
- July 2023
- June 2023
- May 2023
- April 2023
- March 2023
- February 2023
- January 2023
- December 2022
- November 2022
- October 2022
- September 2022
- August 2022
- July 2022
- June 2022
- May 2022
- April 2022
- March 2022
- February 2022
- January 2022
- December 2021
- November 2021
- October 2021
- September 2021
- August 2021
- July 2021
- June 2021
- May 2021
- April 2021
- March 2021
- February 2021
- January 2021
- December 2020
- November 2020
- October 2020
- September 2020
- August 2020
- July 2020
- June 2020
- May 2020
- April 2020
- March 2020
- February 2020
- January 2020
- December 2019
- November 2019
- October 2019
- September 2019
- August 2019
- July 2019
- June 2019
- May 2019
- April 2019
- March 2019
- February 2019
- January 2019
- December 2018
- November 2018
- October 2018
- September 2018
- August 2018
- July 2018
- June 2018
- May 2018
- April 2018
- March 2018
- February 2018
- January 2018
- December 2017
- November 2017
- October 2017
- September 2017
- August 2017
- July 2017
- June 2017
- May 2017
- April 2017
- March 2017
- February 2017
- January 2017
- December 2016
- November 2016
- October 2016
- September 2016
- August 2016
- July 2016
- June 2016
- May 2016
- April 2016
- March 2016
- February 2016
- January 2016
- December 2015
- November 2015
- October 2015
- September 2015
- August 2015
- July 2015
- June 2015
- May 2015
- April 2015
- March 2015
- February 2015
- January 2015
- December 2014
- November 2014
- October 2014
- September 2014
- August 2014
- July 2014
- June 2014
- May 2014
- April 2014
- March 2014
- February 2014
- January 2014
- December 2013
- November 2013
- October 2013
- September 2013
- August 2013
- July 2013
- June 2013
- May 2013
- April 2013
- March 2013
- February 2013
- January 2013
- December 2012
- November 2012
- October 2012
- September 2012
- August 2012
- July 2012
- June 2012
- May 2012
- April 2012
- March 2012
- February 2012
- January 2012
- December 2011
- November 2011
- October 2011
- September 2011
- August 2011
- July 2011
- June 2011
- May 2011
- April 2011
- March 2011
- February 2011
- January 2011
- December 2010
- November 2010
- October 2010
- September 2010
- August 2010
- July 2010
- June 2010
- May 2010
- April 2010
- March 2010
- February 2010
- January 2010
- December 2009
- November 2009
- October 2009
- September 2009
- August 2009
- July 2009
- June 2009
- May 2009
- April 2009
- March 2009
- February 2009
- January 2009
- December 2008
- November 2008
- October 2008
- September 2008
- August 2008
- July 2008
- June 2008
- May 2008
- April 2008
- March 2008
- February 2008
- January 2008
- December 2007
- November 2007
- October 2007
- September 2007
- August 2007
- July 2007
- June 2007
- May 2007
- April 2007
- March 2007
- February 2007
- January 2007
- December 2006
- November 2006
- October 2006
- September 2006
- August 2006
- July 2006
- June 2006
- May 2006
- April 2006
- March 2006
- February 2006
- January 2006
- December 2005
- November 2005
- October 2005
- September 2005
- August 2005
- July 2005
 Eddy Elfenbein is a Washington, DC-based speaker, portfolio manager and editor of the blog Crossing Wall Street. His