-
Five Homebuilding Stocks
Posted by Eddy Elfenbein on June 27th, 2007 at 5:34 pmIt hasn’t been a good two years.
-
Carly Fiorina on CNBC
Posted by Eddy Elfenbein on June 27th, 2007 at 4:39 pmThis is strange. Maria asks Carly Fiorina about the behavior of corporate boards. Yet every single part of her answer was a not-so-hidden dig at HP.
Maria: Do you think the corporate governance environment has improved in the last five years? Meaning, are directors more independent today?
Carly: Well, first I think that anything that increases the transparency and the accountability of a group’s actions is a good thing, and I think that applies to a board as well. Secondly, I think there are some common themes that define good corporate governance.
I’ve sat on many, many boards as you know. I think good boards keep their deliberations confidential (unlike what I had) but are transparent about their decisions. I think good boards deliberate in an atmosphere of calm (unlike what I had) and consider all of the points of view (unlike what I had), and strive always for unanimity (unlike what I had).
And finally, I think good boards have board members with judgment (unlike what I had) and perspective (unlike what I had) and ethics (unlike what I had), and if those three things sound kind of sound old-fashioned (ugh!), it’s because they are. There’s no silver bullet for good corporate governance. But I think in general, transparency about decisions and accountability for decisions is a good thing.Aw, poor widdle Carly. So how’s HP’s stock doing since she left?
-
Bed Bath & Beyond Earns 38 Cents a Share
Posted by Eddy Elfenbein on June 27th, 2007 at 4:18 pmBed Bath & Beyond (BBBY) just reported earnings of 38 cents a share (technically, 37.6 cents). Sales were up 11.3% to $1.553 billion.
Steven H. Temares, Chief Executive Officer and Member of the Board of Directors of Bed Bath & Beyond Inc. stated, “While we continue to see that the overall retailing environment, especially sales of merchandise related to the home, is challenging, we have taken a long-term approach to our business and work to continue to distance ourselves from our competitors by remaining focused on being our customers’ first choice for the products we offer, domestically, interactively, and over the long-term, internationally. Consistent with this, we were very pleased to have recently executed a lease for our first international store, located in Richmond Hill, Ontario, north of Toronto.”
This is a decent report. Without the warning, the company barely missed previous expectations. Think of it this way, BBBY came in 1.4 cents below the Street’s expectations, yet the market chopped off 291 cents in share. So that miss in effect has a price/earnings ratio of 207.
Fine, I’ll take the other side of that trade.Quarter Sales Gross Profit Operating Profit Net Profit EPS $356,633 $146,214 $28,015 $17,883 $0.06 $451,715 $185,570 $53,580 $33,247 $0.12 $480,145 $196,784 $50,607 $31,707 $0.11 $569,012 $238,233 $77,138 $48,392 $0.17 $459,163 $187,293 $36,339 $23,364 $0.08 $589,381 $241,284 $70,009 $43,578 $0.15 $602,004 $246,080 $64,592 $40,665 $0.14 $746,107 $311,802 $101,898 $64,315 $0.22 $575,833 $234,959 $45,602 $30,007 $0.10 $713,636 $291,342 $84,672 $53,954 $0.18 $759,438 $311,030 $83,749 $52,964 $0.18 $879,055 $370,235 $132,077 $82,674 $0.28 $776,798 $318,362 $72,701 $46,299 $0.15 $903,044 $370,335 $119,687 $75,459 $0.25 $936,030 $386,224 $119,228 $75,112 $0.25 $1,049,292 $443,626 $168,441 $105,309 $0.35 $893,868 $367,180 $90,450 $57,508 $0.19 $1,111,445 $459,145 $155,867 $97,208 $0.32 $1,174,740 $486,987 $161,459 $100,506 $0.33 $1,297,928 $563,352 $231,567 $144,248 $0.47 $1,100,917 $456,774 $128,707 $82,049 $0.27 $1,273,960 $530,829 $189,108 $120,008 $0.39 $1,305,155 $548,152 $190,978 $121,927 $0.40 $1,467,646 $650,546 $283,621 $180,980 $0.59 $1,244,421 $520,781 $150,884 $98,903 $0.33 $1,431,182 $601,784 $217,877 $141,402 $0.47 $1,448,680 $615,363 $205,493 $134,620 $0.45 $1,685,279 $747,820 $304,917 $197,922 $0.67 $1,395,963 $590,098 $148,750 $100,431 $0.35 $1,607,239 $678,249 $219,622 $145,535 $0.51 $1,619,240 $704,073 $211,134 $142,436 $0.50 $1,994,987 $862,982 $309,895 $205,842 $0.72 $1,553,293 $646,109 $154,391 $104,647 $0.38 -
Georgetown Photo Gallery
Posted by Eddy Elfenbein on June 27th, 2007 at 11:59 amI’ll take a quick break from stock talk. On Sunday, I strolled down to Georgetown with my camera. Here are a few shots.
-
BBBY Below $37
Posted by Eddy Elfenbein on June 27th, 2007 at 10:47 amC’mon!
Earnings for Bed Bath & Beyond (BBBY) are due later today and the Street obviously expects lousy news. The company already said to expect 36 cents to 38 cents a share. But a $37 share price seems to be discounting really lousy news. -
The Put Write Index
Posted by Eddy Elfenbein on June 27th, 2007 at 10:09 amI learned something interesting from Roger Nusbaum’s site, as I usually do.
The CBOE has created a Put Write Index, which you can see quoted at Yahoo Finance under ^PUT.
Here’s S&P’s description:The new index, called the CBOE S&P 500 PutWrite Index (PUT) tracks the performance of a hypothetical investment strategy (PUT strategy) that overlays short S&P 500 puts over a money market account. The number of puts is set to collateralize the exposure to S&P 500 downturns. This design provides higher leverage than the BXM strategy, and it can also capture the potentially “rich” premia of S&P 500 put options documented in several academic studies. These studies have found that short option strategies, and especially short put strategies, appear to generate high risk-adjusted returns.
The ^BXM index is for Buy Write Index. Roger thinks this is another development in a larger trend that allows individual investors to use sophisticated investment products that were previously reserved for professionals. I think he’s exactly right. This is what the future will look like.
-
Quote of the Day
Posted by Eddy Elfenbein on June 26th, 2007 at 4:21 pmBill Gross from the PIMCO Web site:
Well prudence and rating agency standards change with the times, I suppose. What was chaste and AAA years ago may no longer be the case today. Our prim remembrance of Gidget going to Hawaii and hanging out with the beach boys seems to have been replaced in this case with an image of Heidi Fleiss setting up a floating brothel in Beverly Hills. AAA? You were wooed Mr. Moody’s and Mr. Poor’s by the makeup, those six-inch hooker heels, and a “tramp stamp.” Many of these good looking girls are not high-class assets worth 100 cents on the dollar. And sorry Ben, but derivatives are a two-edged sword. Yes, they diversify risk and direct it away from the banking system into the eventual hands of unknown buyers, but they multiply leverage like the Andromeda strain. When interest rates go up, the Petri dish turns from a benign experiment in financial engineering to a destructive virus because the cost of that leverage ultimately reduces the price of assets. Houses anyone?
Bess Levin has more.
-
U.S. Home Prices Fell for the 17th Month in a Row
Posted by Eddy Elfenbein on June 26th, 2007 at 12:24 pmWow.
U.S. home prices fell for the 17th month in a row with all regions showing the effect of the housing slowdown, according to a housing index released Tuesday by Standard & Poor’s.
For April, the S&P/Case-Shiller index that covers 10 U.S. cities fell 2.7 percent from a year ago. It was the steepest decline since 1991.
The S&P’s 20-city index showed a 2.1 percent drop in the price for sales of existing single-family homes across the U.S.
The April sales figures show that 14 of 20 cities reported prices had dropped or remained flat compared to 2006, S&P said.
“No region is immune to the weakening price returns,” MacroMarkets Chief Economist Robert Shiller said in a statement.
-
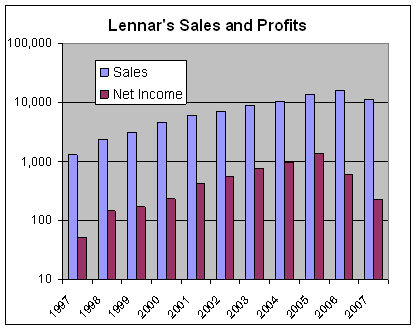
Lennar’s Earnings
Posted by Eddy Elfenbein on June 26th, 2007 at 11:09 amThis morning, Lennar (LEN) reported earnings (or lack thereof). The company lost 22 cents a share and that doesn’t include a huge $1.33 a share charge. Sales dropped 37%.
Here’s a look at Lennar’s sales and earnings for the past few years. The last number is my estimate for this year.
-
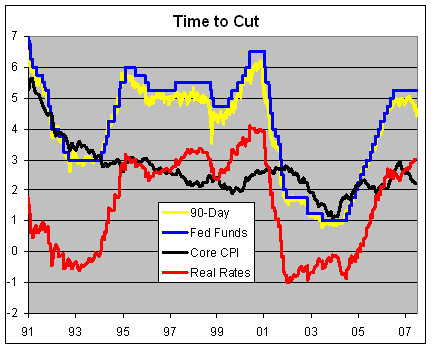
The Fed Should Cut Rates By 0.25%
Posted by Eddy Elfenbein on June 26th, 2007 at 10:00 amThe Federal Reserve is meeting this week, as it’s almost universally expected that nothing will happen. I agree, the Fed won’t raise or lower rates, but I think it’s time that the Fed should lower interest rates. I’m not pushing for a big cut, just a small 25-basis-point cut for now, and we can see where that leads us.
Historically, there have been “fine tuning” measures from the Fed. Ten years ago, the Fed bumped up rates from 5.25% to 5.5%. That was the only move in nearly two-and-half years.
The main reason for my outlook is the sudden drop in short-term interest rates. The 90-day T-bill and the Fed Funds rates almost always track each, but not lately. Last week, the yield on short-term Treasuries dropped below 4.4%. That’s a difference of over 85 basis points from the Fed, and it’s the widest such spread in six years.
Clearly, the market wants a cut. I think the Fed has been most effective when it has given the market what it wants instead of trying to push it where it doesn’t want to go.
The other reason is that inflation seems to be cooling off. Last October, the core rate of inflation got to 2.9% and now it’s backed off to just 2.2%. Most surprisingly, that’s exactly what the Fed said will happen (here’s my exclusive coverage of Bernanke’s testimony from last July).
I know there are many concerns about the government’s measure of inflation, and the use of the core rate. I think these arguments are correct, however, my concern here isn’t the level of inflation but the direction. Inflation maybe higher than they’re telling us, but it’s lower than where it was. This means that the “real” Fed Funds rate, meaning the difference between the Fed’s target rate and inflation, has been increasing. So in effect, as inflation has cooled off, it’s been as if the Fed has continued to raise rates.
The real Fed Funds rate is now slightly over 3%. Historically, anything more than that is trouble for the economy. I also don’t get how gold can be around $650. With 3% real rates, that seems massively overpriced.
Here’s a chart of 90-day T-bills (yellow), the Fed Funds rate (blue), core inflation (black) and the real Fed Funds rate (red) going back to 1991.
- Load More
Does anyone have a suit of armor, jet skis and a blowtorch I can borrow/rent? There's an experiment I'm working on.
This is pretty amazing. US elections combined since 1924:
GOP: 1,058,301,749
DEM: 1,057,846,951
Oth: 88,548,252Unemployment spikes in Washington, DC
-
-
Archives
- April 2025
- March 2025
- February 2025
- January 2025
- December 2024
- November 2024
- October 2024
- September 2024
- August 2024
- July 2024
- June 2024
- May 2024
- April 2024
- March 2024
- February 2024
- January 2024
- December 2023
- November 2023
- October 2023
- September 2023
- August 2023
- July 2023
- June 2023
- May 2023
- April 2023
- March 2023
- February 2023
- January 2023
- December 2022
- November 2022
- October 2022
- September 2022
- August 2022
- July 2022
- June 2022
- May 2022
- April 2022
- March 2022
- February 2022
- January 2022
- December 2021
- November 2021
- October 2021
- September 2021
- August 2021
- July 2021
- June 2021
- May 2021
- April 2021
- March 2021
- February 2021
- January 2021
- December 2020
- November 2020
- October 2020
- September 2020
- August 2020
- July 2020
- June 2020
- May 2020
- April 2020
- March 2020
- February 2020
- January 2020
- December 2019
- November 2019
- October 2019
- September 2019
- August 2019
- July 2019
- June 2019
- May 2019
- April 2019
- March 2019
- February 2019
- January 2019
- December 2018
- November 2018
- October 2018
- September 2018
- August 2018
- July 2018
- June 2018
- May 2018
- April 2018
- March 2018
- February 2018
- January 2018
- December 2017
- November 2017
- October 2017
- September 2017
- August 2017
- July 2017
- June 2017
- May 2017
- April 2017
- March 2017
- February 2017
- January 2017
- December 2016
- November 2016
- October 2016
- September 2016
- August 2016
- July 2016
- June 2016
- May 2016
- April 2016
- March 2016
- February 2016
- January 2016
- December 2015
- November 2015
- October 2015
- September 2015
- August 2015
- July 2015
- June 2015
- May 2015
- April 2015
- March 2015
- February 2015
- January 2015
- December 2014
- November 2014
- October 2014
- September 2014
- August 2014
- July 2014
- June 2014
- May 2014
- April 2014
- March 2014
- February 2014
- January 2014
- December 2013
- November 2013
- October 2013
- September 2013
- August 2013
- July 2013
- June 2013
- May 2013
- April 2013
- March 2013
- February 2013
- January 2013
- December 2012
- November 2012
- October 2012
- September 2012
- August 2012
- July 2012
- June 2012
- May 2012
- April 2012
- March 2012
- February 2012
- January 2012
- December 2011
- November 2011
- October 2011
- September 2011
- August 2011
- July 2011
- June 2011
- May 2011
- April 2011
- March 2011
- February 2011
- January 2011
- December 2010
- November 2010
- October 2010
- September 2010
- August 2010
- July 2010
- June 2010
- May 2010
- April 2010
- March 2010
- February 2010
- January 2010
- December 2009
- November 2009
- October 2009
- September 2009
- August 2009
- July 2009
- June 2009
- May 2009
- April 2009
- March 2009
- February 2009
- January 2009
- December 2008
- November 2008
- October 2008
- September 2008
- August 2008
- July 2008
- June 2008
- May 2008
- April 2008
- March 2008
- February 2008
- January 2008
- December 2007
- November 2007
- October 2007
- September 2007
- August 2007
- July 2007
- June 2007
- May 2007
- April 2007
- March 2007
- February 2007
- January 2007
- December 2006
- November 2006
- October 2006
- September 2006
- August 2006
- July 2006
- June 2006
- May 2006
- April 2006
- March 2006
- February 2006
- January 2006
- December 2005
- November 2005
- October 2005
- September 2005
- August 2005
- July 2005
 Eddy Elfenbein is a Washington, DC-based speaker, portfolio manager and editor of the blog Crossing Wall Street. His