-
The National Mall
Posted by Eddy Elfenbein on December 30th, 2006 at 10:10 pmI saw President Ford’s funeral procession earlier today. Even the monuments seemed to be in a somber mood.


-
2007 Buy List
Posted by Eddy Elfenbein on December 30th, 2006 at 6:55 amHere’s my 2007 Buy List. For tracking purposes, I assume it’s a $1,000,000 portfolio and each position is worth $50,000. Here’s each stock, ticker, starting price and number of shares. This is what I’m refering to when I write on how the Buy List is doing.
Company Ticker Price Shares AFLAC AFL $46.00 1086.9565 Amphenol APH $62.08 805.4124 Bed Bath & Beyond BBBY $38.10 1312.3360 Biomet BMET $41.27 1211.5338 Donaldson DCI $34.71 1440.5071 Danaher DHR $72.44 690.2264 FactSet Research Systems FDS $56.48 885.2691 Fair Isaac FIC $40.65 1230.0123 Fiserv FISV $52.42 953.8344 Graco GGG $39.62 1261.9889 Harley-Davidson HOG $70.47 709.5218 Jos. A Bank Clothiers JOSB $29.35 1703.5775 Medtronic MDT $53.51 934.4048 Nicholas Financial NICK $11.80 4237.2881 Respironics RESP $37.75 1324.5033 SEI Investments SEIC $59.56 839.4896 Sysco SYY $36.76 1360.1741 UnitedHealth UNH $53.73 930.5788 Varian Medical Systems VAR $47.57 1051.0826 WR Berkley BER $34.51 1448.8554 Fifteen stocks return from 2006. The five new stocks are Amphenol, Graco, Jos. A Bank Clothiers, Nicholas Financial and WR Berkley. The sells are Brown & Brown, Dell, Expeditors, Home Depot and Wachovia.
The total market cap of all the companies is $288 billion, which is much smaller than last year. UnitedHealth is the largest at $72 billion. Nicholas Financial is by far the smallest at $117 million. The average dividend yield is 0.55%.
That’s it. The list is now “lock and sealed,” and I can’t touch it until next year. -
The 2006 Buy List
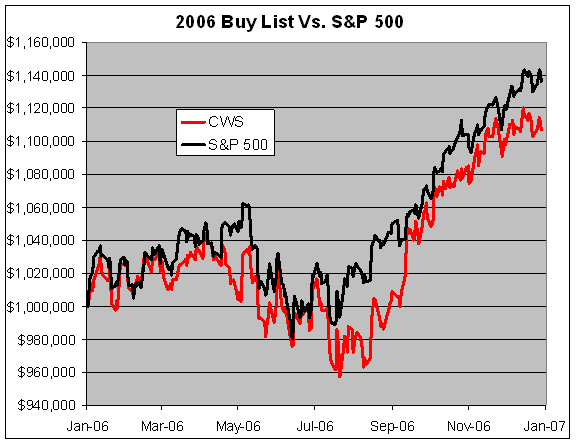
Posted by Eddy Elfenbein on December 29th, 2006 at 7:33 pmThe 2006 trading year has come to a close. All in all, it was a very good year for our Buy List.
The 20 stocks on the Buy List were up an average of 10.68%, while the S&P 500 was up 13.62%. Including dividends, the Buy List was up 11.43%, and the S&P 500 was up 15.80%. The daily volatility of the Buy List was 19.22% greater than the S&P 500. The Buy List had a “beta” of 1.0404, and its daily changes were 76% correlated with the S&P 500.
I track the Buy List as if it were a $1 million portfolio. Here’s how each stock did during 2006:
Stock Ticker 12/30/05 Shares Value 12/29/06 Value Gain SEI Investments SEIC $37.00 1351.3514 $50,000 $59.56 $80,486.49 60.97% FactSet Research FDS $41.16 1214.7716 $50,000 $56.48 $68,610.30 37.22% Harley-Davidson HOG $51.49 971.0623 $50,000 $70.47 $68,430.77 36.86% Danaher DHR $55.78 896.3786 $50,000 $72.44 $64,933.67 29.87% Fiserv FISV $43.27 1155.5350 $50,000 $52.42 $60,573.14 21.15% Expeditors Intl* EXPD $33.755 1481.2620 $50,000 $40.50 $59,991.11 19.96% Wachovia** WB $47.64554 1049.4163 $50,000 $56.95 $59,764.26 19.52% Sysco SYY $31.05 1610.3060 $50,000 $36.76 $59,194.85 18.39% Biomet BMET $36.57 1367.2409 $50,000 $41.27 $56,426.03 12.85% Donaldson DCI $31.80 1572.3270 $50,000 $34.71 $54,575.47 9.15% Bed Bath & Beyond BBBY $36.15 1383.1259 $50,000 $38.10 $52,697.09 5.39% Respironics RESP $37.07 1348.7996 $50,000 $37.75 $50,917.18 1.83% Home Depot HD $40.48 1235.1799 $50,000 $40.16 $49,604.74 -0.79% AFLAC AFL $46.42 1077.1219 $50,000 $46.00 $49,547.61 -0.90% Varian Medical VAR $50.34 993.2459 $50,000 $47.57 $47,248.71 -5.50% Medtronic MDT $57.57 868.5079 $50,000 $53.51 $46,473.86 -7.05% Brown & Brown BRO $30.54 1637.1971 $50,000 $28.21 $46,185.33 -7.63% Fair Isaac FIC $44.17 1131.9900 $50,000 $40.65 $46,015.39 -7.97% UnitedHealth UNH $62.14 804.6347 $50,000 $53.73 $43,233.02 -13.53% Dell DELL $29.95 1669.4491 $50,000 $25.09 $41,886.48 -16.23% Total $1,000,000 $1,106,795.50 10.68% * Expeditors split 2-for-1 on June 26.
** The original position was Golden West Financial (GDW), which was bought out by Wachovia at the end of the third quarter. The merger called for Golden West shareholders to get 1.051 shares of Wachovia stock, plus $18.65 cash for each share of Golden West. At the beginning of 2006, we tracked 757.5758 shares of Golden West priced at $66 each. With the merger, we then had 796.2122 shares of WB (757.5758*1.051), plus $14,128.79 in cash (757.5758*$18.65). For track record purposes, I assumed the entire cash position was immediately converted into shares of Wachovia. Going by the September 29 closing price of $55.80 for WB, the cash was exchanged for another 253.2041 shares ($14,128.79/$55.80). So we then had a total position of 1049.4163 shares of WB with a cost basis of $47.64554 ($50,000/1049.4163).Here’s how the Buy List did against the S&P:
-
Stock Exchange to Close on Tuesday
Posted by Eddy Elfenbein on December 29th, 2006 at 11:18 amIt’s official. The markets will be closed on Tuesday in honor of President Ford’s funeral. Trading will resume on Wednesday.
-
Stocks Against Bonds
Posted by Eddy Elfenbein on December 29th, 2006 at 8:36 amDecember has brought a major change to the financial markets, although it’s largely gone unnoticed. For the first time since June, the stock and bond markets have become decoupled. In other words, stocks are going up while long-term bonds are going down.
Yesterday, the yield on the thirty-year Treasury bond (^TYX) broke 4.8% for the first time in seven weeks. Despite this, the S&P 500 (^GSPC) has continued to rally, and it now stands just shy of a six-year high.
This is important because the bond market often acts as an early warning sign for the stock market. Decoupling usually precedes bad news for stocks. For example, stocks and bonds became negatively correlated beginning on April 25, shortly before the May 5 top. The negative correlation lasted until June 15, which was two days after the S&P 500’s low for the year. It’s as if the two asset groups were competing against each for investors’ money, and the bond market was winning.
But all that changed on June 16. From there until late-November, stocks and bonds (BTTRX is my bond proxy) had an amazing 79% correlation. Basically, the two asset classes stopped fighting with each other and marched higher arm-in-arm. It was a nice, smooth rally.
The truce finally came to an end. Since November 30, stocks and bonds have had a 60% negative correlation. This is a brief period, so it may not mean much, but something is definitely up. I don’t think the stock market is about to collapse, but we’ve had a 16% rally since June. It may be time for a breather. -
10 Best Business Movies
Posted by Eddy Elfenbein on December 28th, 2006 at 9:53 pmFrom The American:
Barcelona
Jerry Maguire
Lost in Translation
Once Upon a Time in the West
The Shop Around the Corner
Trading Places
One, Two, Three
Mildred Pierce
Working Girl
Glengarry Glen Ross
Under the American’s rules, the films aren’t allowed to be “openly hostile to capitalism.” That’s a far bigger handicap than I realized. -
Jeff Matthews Ridicules Amazon So We Don’t Have To
Posted by Eddy Elfenbein on December 28th, 2006 at 5:06 pmJeff Matthews notices a theme in Amazon’s Christmastime press releases:
12/26/2006 “Amazon.com’s 12th Holiday Season is Best Ever”
12/26/2005 “Amazon.com, Inc. today announced that the 2005 holiday season finished as its best ever…”
12/27/2004 “Amazon.com’s Tenth Holiday Season is Best Ever…”
12/26/2003 “Amazon.com Wraps Up Its Ninth Holiday With Busiest Season Ever.”
12/26/2002 “Amazon.com today announced it has finished its busiest holiday season ever…”“The best Christmas EVER!” Don’t you have to be Claymation to say stuff like that?
-
Dow 12,500
Posted by Eddy Elfenbein on December 28th, 2006 at 12:15 pmYesterday, the Dow closed above 12,500 for the first time ever. But the Dow has actually been a laggard. If the Dow had merely kept pace with the Wilshire 5000 over the last four years, which is the broadest measure of the market, then the index would currently be over 14,300.
-
Markets and Morality
Posted by Eddy Elfenbein on December 28th, 2006 at 9:34 amHere’s a quick thought exercise. Assume that in your town or city, or even country, voters are evenly divided between two public policy decisions. Let’s ignore what the choices are, but instead, I will tell you that one choice is a more abstract, theoretical choice, while the other is grounded in real-world understanding. Given your biases, which would you be inclined to support?
There are few guarantees in life, however, if we were to ask the platonic financial economist, he or she will always and forever—one million times out of a million—argue for the abstract decision. To many financial economists, all investors’ problems are simply a problem of emotions. The people always suffer from insufficient self-denial.
It’s a huge mistake to interpret the judgments of the financial markets as moral judgments, but this happens all the time. To choose an obvious example, it’s easy to think the collapse of the Internet boom was punishment for earlier greed. You would get few thoughtful people to admit to that in public, but they do, perhaps unwittingly, believe it.
You can also find this in the financial media all the time. For example, when the housing market soars, it’s due to greedy, irrational Americans bidding up prices. We’re told that the root cause is always the victory of emotions over reason.
But what happens when the bond market soars? Nope, no judging here. Bond traders are somehow always right. You can wait a long time before you will hear the words “bond bubble.” The same holds true for oil.
The uncrowned king of this school of thought is Robert Shiller of Yale. The best part of being a member of this school is that you never have to be right. One only needs to look worried. Finger-wagging is good too. Also, you can earn extra points if you find new things to worry about.
But when you closely look at investment bubbles, they’re often less irrational than they appear. Remember, eBay is higher now than it was six years ago, but GE is down. Which one was the bubble? I have my answer.
The real mob mentality is crowd of observers trying to be the lone voice of reason in a sea of madness. Consider this Lawrence Summers’ editorial from earlier this week:The headlines and opinion writers focus on how the U.S. is badly bogged down in wars in Afghanistan and Iraq; on an increasingly unstable Middle East and dangerous energy dependence; on nuclear proliferation that has already occurred in North Korea and that is coming in Iran; on the potential weakness of lame-duck political leaders; on record global trade imbalances and rising protectionist pressures; on increased levels of public and private-sector borrowing combined with record low saving in the United States; and on falling home prices and middle-class economic insecurity.
At the same time, financial markets are pricing in an expectation of tranquility as far as the eye can see. Stock prices in the U.S. are at all-time highs (uhm…no Larry, they’re not). The risk premiums that corporations or developing countries have to pay to borrow money are at or near historic lows. In addition, estimates of the volatility of the stock, bond and foreign exchange markets inferred from the prices of options are near record lows.Summers has brought professional worrying to a new level. Our reason to be concerned is that…(drumroll)…we’re overly cautious! He’s confusing the lack of volatility with a carefree attitude. Actually, it’s just the opposite. But Summers’ argument is that overcautiousness is the very reason to be worried.
When you turn financial analysis into moral judgments, you misunderstand an important aspect of the market’s nature. The market has zero moral intelligence. The market simply moves capital from less productive assets to more productive. Trying to find a morality tale beneath the suface won’t help you explain what’s going on. -
Bill Miller’s Streak to End
Posted by Eddy Elfenbein on December 28th, 2006 at 8:23 amAfter 15 years, Legg Mason’s Bill Miller will lose to the S&P 500. He made some bad calls this year on housing and tech.
Miller’s $21 billion Legg Mason Value Trust was up 6.7 percent as of yesterday, trailing the 16.5 percent gain of the S&P 500. The mutual fund is the worst performer of 108 “multicap value” funds tracked by Bloomberg that buy stocks managers perceive as being cheap. Miller’s fund, which holds fewer than 45 stocks, was hurt by Amazon.com Inc. and UnitedHealth Group Inc.
“It’s not the right portfolio for 2006,” said Jeff Tjornehoj, a Denver-based analyst at Lipper who tracks the fund industry. “Perhaps it will be the right portfolio for 2007.”
The Legg Mason fund has beaten the S&P 500 every year since 1991, rising at an average annual rate of 15.8 percent, compared with 11.9 percent for the U.S. stock benchmark. Miller also manages the $6.7 billion Legg Mason Opportunity Trust, which is lagging behind the S&P 500 this year with its 14.2 percent return. Miller, 56, declined to comment.
- Load More
Does anyone have a suit of armor, jet skis and a blowtorch I can borrow/rent? There's an experiment I'm working on.
This is pretty amazing. US elections combined since 1924:
GOP: 1,058,301,749
DEM: 1,057,846,951
Oth: 88,548,252Unemployment spikes in Washington, DC
-
-
Archives
- April 2025
- March 2025
- February 2025
- January 2025
- December 2024
- November 2024
- October 2024
- September 2024
- August 2024
- July 2024
- June 2024
- May 2024
- April 2024
- March 2024
- February 2024
- January 2024
- December 2023
- November 2023
- October 2023
- September 2023
- August 2023
- July 2023
- June 2023
- May 2023
- April 2023
- March 2023
- February 2023
- January 2023
- December 2022
- November 2022
- October 2022
- September 2022
- August 2022
- July 2022
- June 2022
- May 2022
- April 2022
- March 2022
- February 2022
- January 2022
- December 2021
- November 2021
- October 2021
- September 2021
- August 2021
- July 2021
- June 2021
- May 2021
- April 2021
- March 2021
- February 2021
- January 2021
- December 2020
- November 2020
- October 2020
- September 2020
- August 2020
- July 2020
- June 2020
- May 2020
- April 2020
- March 2020
- February 2020
- January 2020
- December 2019
- November 2019
- October 2019
- September 2019
- August 2019
- July 2019
- June 2019
- May 2019
- April 2019
- March 2019
- February 2019
- January 2019
- December 2018
- November 2018
- October 2018
- September 2018
- August 2018
- July 2018
- June 2018
- May 2018
- April 2018
- March 2018
- February 2018
- January 2018
- December 2017
- November 2017
- October 2017
- September 2017
- August 2017
- July 2017
- June 2017
- May 2017
- April 2017
- March 2017
- February 2017
- January 2017
- December 2016
- November 2016
- October 2016
- September 2016
- August 2016
- July 2016
- June 2016
- May 2016
- April 2016
- March 2016
- February 2016
- January 2016
- December 2015
- November 2015
- October 2015
- September 2015
- August 2015
- July 2015
- June 2015
- May 2015
- April 2015
- March 2015
- February 2015
- January 2015
- December 2014
- November 2014
- October 2014
- September 2014
- August 2014
- July 2014
- June 2014
- May 2014
- April 2014
- March 2014
- February 2014
- January 2014
- December 2013
- November 2013
- October 2013
- September 2013
- August 2013
- July 2013
- June 2013
- May 2013
- April 2013
- March 2013
- February 2013
- January 2013
- December 2012
- November 2012
- October 2012
- September 2012
- August 2012
- July 2012
- June 2012
- May 2012
- April 2012
- March 2012
- February 2012
- January 2012
- December 2011
- November 2011
- October 2011
- September 2011
- August 2011
- July 2011
- June 2011
- May 2011
- April 2011
- March 2011
- February 2011
- January 2011
- December 2010
- November 2010
- October 2010
- September 2010
- August 2010
- July 2010
- June 2010
- May 2010
- April 2010
- March 2010
- February 2010
- January 2010
- December 2009
- November 2009
- October 2009
- September 2009
- August 2009
- July 2009
- June 2009
- May 2009
- April 2009
- March 2009
- February 2009
- January 2009
- December 2008
- November 2008
- October 2008
- September 2008
- August 2008
- July 2008
- June 2008
- May 2008
- April 2008
- March 2008
- February 2008
- January 2008
- December 2007
- November 2007
- October 2007
- September 2007
- August 2007
- July 2007
- June 2007
- May 2007
- April 2007
- March 2007
- February 2007
- January 2007
- December 2006
- November 2006
- October 2006
- September 2006
- August 2006
- July 2006
- June 2006
- May 2006
- April 2006
- March 2006
- February 2006
- January 2006
- December 2005
- November 2005
- October 2005
- September 2005
- August 2005
- July 2005
 Eddy Elfenbein is a Washington, DC-based speaker, portfolio manager and editor of the blog Crossing Wall Street. His