-
Danaher Earns $2.46 per Share
Posted by Eddy Elfenbein on July 22nd, 2021 at 7:18 amDanaher Corporation (DHR) today announced results for the second quarter 2021. All results in this release reflect only continuing operations unless otherwise noted.
For the quarter ended July 2, 2021, net earnings were $1.7 billion, or $2.28 per diluted common share which represents an 84.0% year-over-year increase from the comparable 2020 period. Non-GAAP adjusted diluted net earnings per common share were $2.46 which represents a 71.0% increase over the comparable 2020 period.
Revenues increased 36.5% year-over-year to $7.2 billion, with 31.5% non-GAAP core revenue growth.
Operating cash flow for the second quarter was $2.1 billion, representing a 46.5% increase year-over-year, and non-GAAP free cash flow was $1.8 billion, representing a 41.0% increase year-over-year.
For the third quarter 2021, the Company anticipates that non-GAAP core revenue growth will be in the mid- to high-teens percent range.
For the full year 2021, the Company now anticipates that the non-GAAP core revenue growth rate including Cytiva will be approximately 20%.
Rainer M. Blair, President and Chief Executive Officer, stated, “Broad-based strength across the portfolio helped us deliver over 30% core revenue growth and outstanding earnings per share growth and cash flow generation. We continued to make significant growth investments during the quarter, strengthening our organic growth trajectory and enhancing our portfolio with the announcement of our pending acquisition of Aldevron.”
Blair continued, “We believe the combination of our leading portfolio and DBS-driven execution differentiates Danaher today and provides a strong foundation for sustainable, long-term outperformance.”
-
Morning News: July 22, 2021
Posted by Eddy Elfenbein on July 22nd, 2021 at 5:31 amECB Set to Promise Even Longer Support to Charge Inflation
The Saudi Prince of Oil Prices Vows to Drill ‘Every Last Molecule’
China’s Vast Network of Gray-Market Shoppers Grounded by the Pandemic
U.S.-China Goods Trade Booms as If Virus, Tariffs Never Happened
FTC Unanimously Backs New Policy Supporting Your Right to Repair Your Own Devices
Flush From Reddit Rally, GameStop Plots Store Revival
Robinhood’s Guinea Pig for Upending Public Offerings: Itself
Skipping the Olympics Is ‘Not an Option’ for Many Advertisers
The Amazonification of Space Begins in Earnest
Hamptons Home Prices Surge to a Record as Pickings Get Slimmer
Tesla Factory in Berlin Runs Into Activists, Red Tape and Lizards
Hyundai Motor Q2 Net Profit Soars, Expects Chip Shortage to Ease
Harley-Davidson Just Launched Its Own Craigslist
Billionaire Who Missed Out on TikTok Is Trying to Beat It
Big 3 Drug Distributors, J&J Reach Landmark $26 Billion Opioid Settlement
Be sure to follow me on Twitter.
-
Another Bounce off the 50-DMA
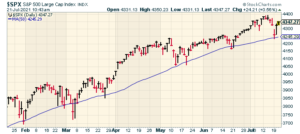
Posted by Eddy Elfenbein on July 21st, 2021 at 10:48 amThe S&P 500 is gaining more ground today. Once again, the 50-DMA is acting like a trampoline.
Every time we’ve gotten close to the 50-DMA, the market has bounced. Every time.
This morning, Coca-Cola (KO) reported very good earnings. The company beat estimates and raised its full-year forecast.
-
Morning News: July 21, 2021
Posted by Eddy Elfenbein on July 21st, 2021 at 7:10 amSingapore’s Grip on $30 Billion Market Challenged by China
Is the U.S. Economy Too Hot or Too Cold? Yes.
‘Every Time, It’s Messy:’ U.S. Again Approaching Debt Ceiling
One Simple (Political) Reason to Explain Bond Yields
Biden to Name a Critic of Big Tech as the Top Antitrust Cop
U.S. Mortgage Applications Decline in Latest Week as Rates Steadily Rise
Bankers Need 72-Hour Week to Master Job, $4 Trillion Wealth Manager Says
JPMorgan Entices Dimon to Stick Around With Surprise Award
Netflix to Add Mobile Video Games as Subscriber Growth Slows
Disney Is Chipping Away At Netflix’s Dominance.
Raytheon CEO Sees Hypersonic-Weapons Era: ‘Speed Trumps Stealth’
Space Tourism Tax: Congressman Announces New Plan After Blue Origin Launch
Taco Bell Latest Fast-Food Chain to Face Supply Shortages
Coca-Cola Quarterly Revenue Tops 2019 Levels; Company Raises Full-Year Forecast
8 Hours a Day, 5 Days a Week Is Not Working for Us
Be sure to follow me on Twitter.
-
CWS Market Review – July 20, 2021
Posted by Eddy Elfenbein on July 20th, 2021 at 7:11 pmThis is the free version of CWS Market Review. If you have a chance, please sign up for the premium newsletter for $20 per month or $200 for the whole year.
High-Beta Stocks Snap
The stock market rose today which snapped a three-day losing streak. On Monday, the S&P 500 suffered its biggest drop in two months. At one point during the trading day, the index dropped below its 50-day moving average. That’s often a key bearish move for chart-watchers.
What’s interesting is that the S&P 500 has come close to dipping below its 50-DMA a few times. In fact, it’s gone below it as well. However, each time the index gets near the 50-DMA, it acts almost like a trampoline. Every dip has become a buying opportunity. It happened again today.
Here’s a great fact: The S&P 500 hasn’t closed below its 50-DMA on back-to-back days since October. That makes this the longest such streak in 25 years.
The takeaway is that this has been a very calm and consistently rising market. That’s why any break has gotten some attention. It’s hard to think of a market where “buy the dip” has worked so consistently.
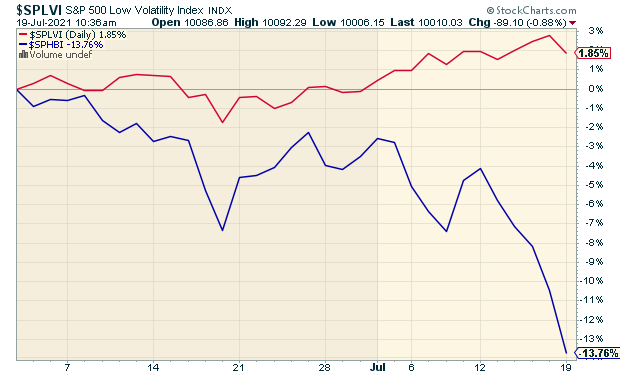
But what’s really stood out recently has been the divergence between High Beta stocks and Low Volatility stocks. In plain English, these are stocks that move around a lot compared with the stocks that are more stable. Historically, the stable ones have done better, but the High Beta ones can be dramatic winners in a short period of time.
It’s important to follow how these two types of stocks are performing relative to each other. When High Beta does well, that usually means investors are getting greedier. When Low Vol takes the lead, that usually means that investors are becoming more cautious. It’s not that one is better than the other. Rather, it’s a question of how investors feel about the current cycle.
Since the pandemic low, the High Beta stocks have been big winners. I think that’s because of the optimism regarding the economy. Not that things are going swimmingly, but things are going better than the smart money had expected, especially since the beginning of the year.
Since early June, however, the Low Vol stocks have been making their comeback. It started out quietly, but it got very dramatic over the last four days. Monday turned into an all-out rout for the High Beta stocks.
Look at how dramatically the High Beta sector (blue line) has broken down.
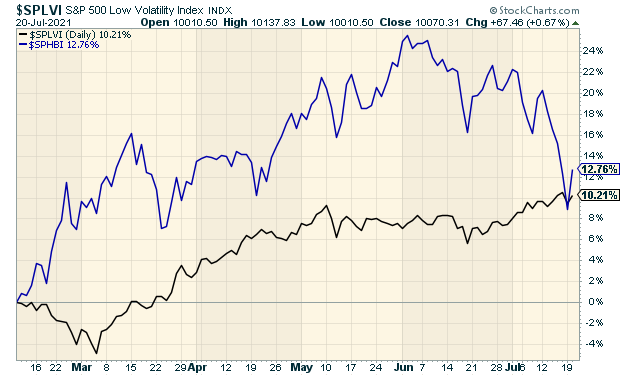
It’s funny that you can easily see that the black line is clearly less volatile.
Our Buy List isn’t exactly a Low Vol portfolio, but it leans in that direction. Quick note: When you build a portfolio—really, any portfolio—you’ll find that you’ll unintentionally skew in one direction or another. That’s just how investing is. For example, if you buy a lot of REITs or Utilities, you’ll quickly find that your portfolio is very sensitive to any interest-rate comments from the Federal Reserve.
I didn’t plan to have a Low Vol portfolio. I chose what I liked, and it turned out that the majority of our stocks bend in that direction. The good news is that we’ve outperformed the overall market significantly over the past few days.
The shift to Low Vol has been too big to ignore. It’s not just a little bump like we’ve seen before. I think this could be the turning point for this cycle. Unfortunately, pinpointing the starting or ending points of market cycles is a notoriously difficult task. This earnings season will probably tell us a lot more where we stand. We have two Buy List earnings reports later this week, and 13 more coming next week. I suspect that Low Vol will continue to lead.
Nearing the Top in the Presidential Election Cycle
That’s not the only cycle to watch. Circle your calendars for August 4. Why? Because that’s been the traditional peak in the four-year market cycle.
I took all of the daily closes of the Dow Jones Industrial Average going back to its beginning 125 years ago. I then crunched what the average four-year cycle looks like. I found that the market peaks on August 4 of the post-election year.
Here’s what the cycle looks like. I started the line at 100 at the beginning of the post-election year.
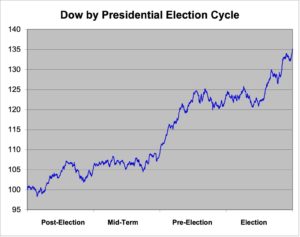
This mini-bear market lasts for about 14 months, until September 30 of the mid-term year. Over that time, the market loses about 2.58%. That may not seem like a lot—and it’s not—but for a 14-month segment in a 125-year data series, it stands out.
For the other 34 months, the Dow has had an average gain of 38.73%. There’s another slow period from the middle of the pre-election year to the middle of the election year. Except for those two periods, the market does quite well.
Let me be clear: I don’t put faith in these types of stats. I think they’re interesting in a general sense. I would never make a market decision based on this.
Still, it’s interesting that incumbent presidents have probably had an effect on the stock markets. They work to make the economy peak by election day. The rally lasts for a few months before it stalls out. The market eventually bottoms around the mid-term elections. One of the best things about being a long-term investor is that you don’t have to worry about such things.
Don’t forget to sign up for our premium newsletter. It’s just $20 per month or $200 for a full year. With earnings season coming up, you don’t want to miss out!
The Shortest Recession Ever!
This National Bureau for Economic Research (NBER) is considered to be the industry standard in economics for dating economic recessions and expansions. They already told us that the economy went into recession in March 2020 (duh).
We had been waiting for the official word on when the recession ended. This week, NBER said the economy bottomed in April 2020. That means it was just a two-month recession. That’s the fastest one on record. NBER lists all the economic cycles going back to 1854.
The previous record for fastest recession was a six-month recession during the first half of 1980. That was a generally chaotic time for the U.S. economy.
You often hear in the media that a recession is two or more consecutive quarters of negative GDP growth. That’s a good ballpark definition of a recession, but it’s not precisely correct.
This is the official policy from NBER. (My apologies for the econo-speak).
In determining the dates of business cycle turning points, the committee follows standard procedures to assure continuity in the chronology. Because a recession must influence the economy broadly and not be confined to one sector, the committee emphasizes economy-wide measures of economic activity. It views real gross domestic product (GDP) as the single best measure of aggregate economic activity. This concept is measured two ways by the US Bureau of Economic Analysis (BEA)—from the expenditure side and from the income side. Because the two measures have strengths and weaknesses and differ by a statistical discrepancy, the committee considers real GDP and real gross domestic income (GDI) on an equal footing. It also places considerable weight on total payroll employment as measured by the Bureau of Labor Statistics (BLS).
Basically, real GDP is the best. The problem is that that’s quarterly data so the committee uses monthly data like nonfarm payrolls to fill in the gaps.
In March and April 2020, the U.S. economy lost 22 million jobs. Since then, we’ve added back over 15 million. We’re still a long way from full employment, but I don’t see any recession on the horizon.
Mueller Industries Jumps 7%
A few weeks ago, I highlighted Mueller Industries (MLI) for you. At the time, I said “Keep an eye on Mueller. This could be a big winner in the months ahead.” The shares jumped nearly 7% today thanks to a great earnings report.
One of the reasons why I like Mueller, other than being a great company, is that it’s mostly ignored by Wall Street. Mueller is a leading manufacturer of copper, brass, aluminum and plastic products. This is a classic small-cap cyclical stock. Once you realize the scope of their business, you understand that the use of Mueller’s products is seemingly endless. Mueller makes everything from copper tubing and fittings to brass and copper alloy bars and refrigeration valves.
You can find Mueller most anywhere. Some of the companies that rely on Mueller are in sectors like plumbing, heating, air conditioning, refrigeration, appliance, medical, automotive, military and defense, marine and recreational. Mueller’s operations are located throughout the United States and in Canada, Mexico, Great Britain, South Korea, and China.
Over the last 30 years, MLI has gained more than 110-fold (including dividends).
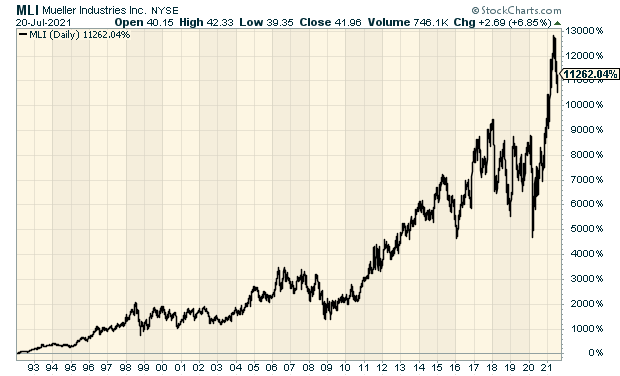
This morning, Mueller reported Q2 earnings of $1.92 per share. That’s up from 50 cents for last year’s Q2. How does that compare with Wall Street’s consensus? Well, that’s hard to say because no analysts currently provide earnings estimates. Given the market’s strong reaction, we can probably assume that it was much better than expected.
It’s pretty amazing that a company that’s been around for over 100 years and has gained more than 100-fold in 30 years is virtually ignored by Wall Street. I’ll reiterate what I said before, keep an eye on Mueller. This can be a big winner for investors.
That’s all for now. I’ll have more for you in the next issue of CWS Market Review.
– Eddy
Don’t forget to sign up for our premium newsletter. It’s full of news and analysis on our Buy List portfolio. Also, if you sign up now, you can see our two recent reports. “Your Handy Guide to Stock Orders” tells you about all the different types of stock orders investors can place. Also, there’s “How Not to Get Screwed on Your Mortgage.” Join us today!
-
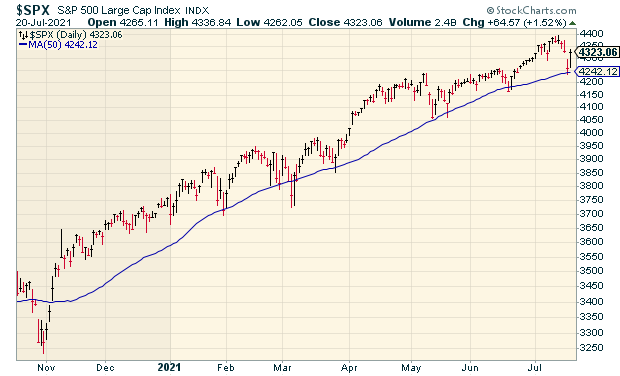
The 50-DMA Holds and the Market Rebounds
Posted by Eddy Elfenbein on July 20th, 2021 at 11:10 am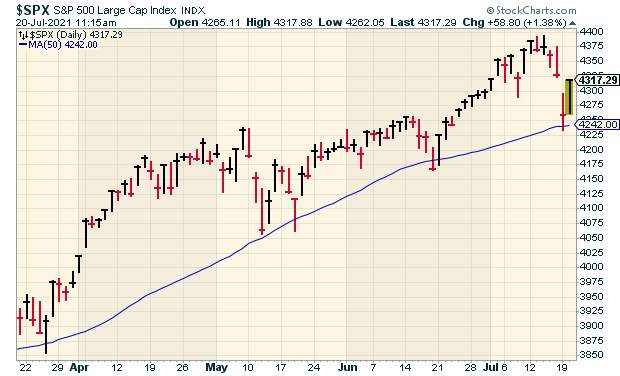
Yesterday, the S&P 500 dipped below its 50-day moving average but importantly, did not close below it. The market is rebounding nicely today.
Some of the big losers yesterday were airlines and cruise stocks. In other words, companies tied to lockdowns. That’s the fear hanging over Wall Street.
This week is all about earnings. We’ll get our first two Buy List earnings reports on Thursday.
This morning’s housing starts report showed an increase for June. Housing starts increased 6.3% to a seasonally adjusted annual rate of 1.643 million. Economists had been expecting an increase of 1.590 million.
The other report was for building permits. That dropped by 5.1% last month. Since May, lumber futures are down 70%.
-
Morning News: July 20, 2021
Posted by Eddy Elfenbein on July 20th, 2021 at 7:03 amU.S. Recession Ended in April 2020, Making It Shortest on Record
Inflation Is Here — These 35 Metrics Tell You How Much to Worry
As Stablecoins Explode in Popularity, Regulators Prepare A Response
‘A Lot of Very Young People’ Are Going to Buy the Dip in Stocks
The Battles to Come Over the Benefits of Working From Home
‘Game Over’: Food Carts Adjust to a Changed City
Top Brewers Toast Easing of Pandemic Curbs with Zero Alcohol Beer
The Invisible Hand Behind the Tokyo Olympics
Running Low on Battery Power: Brexit Britain Faces an Acid Test
In Push to Supply Tesla, Piedmont Lithium Irks North Carolina Neighbors
Israel Warns Unilever Chief Over Ben & Jerry’s Boycott
Ben & Jerry’s Will Stop Selling Ice Cream in Palestinian Territories
LVMH Gives Designer Virgil Abloh Bigger Role, Buys Stake in Off-White
SPAC U-Turn Mars Ackman’s Hedge Fund Pivot
Another Senior Goldman Sachs Executive Is Leaving – And Colleagues Are Vexed
Be sure to follow me on Twitter.
-
NBER Calls the Official Recession Dates
Posted by Eddy Elfenbein on July 19th, 2021 at 2:44 pmThe National Bureau of Economic Research is widely considered to the be the official standard for dating economic recessions.
They just called the most recent recession. The peak was in February 2020 and the trough was in April 2020. This was the fastest recession on record.
The Business Cycle Dating Committee of the National Bureau of Economic Research maintains a chronology of the peaks and troughs of US business cycles. The committee has determined that a trough in monthly economic activity occurred in the US economy in April 2020. The previous peak in economic activity occurred in February 2020. The recession lasted two months, which makes it the shortest US recession on record.
The NBER chronology does not identify the precise moment that the economy entered a recession or expansion. In the NBER’s convention for measuring the duration of a recession, the first month of the recession is the month following the peak and the last month is the month of the trough. Because the most recent trough was in April 2020, the last month of the recession was April 2020, and May 2020 was the first month of the subsequent expansion.
You’ll often hear that a recession is two or more quarters of negative economic growth. That’s not exactly right. From their website:
In determining the dates of business cycle turning points, the committee follows standard procedures to assure continuity in the chronology. Because a recession must influence the economy broadly and not be confined to one sector, the committee emphasizes economy-wide measures of economic activity. It views real gross domestic product (GDP) as the single best measure of aggregate economic activity. This concept is measured two ways by the US Bureau of Economic Analysis (BEA)—from the expenditure side and from the income side. Because the two measures have strengths and weaknesses and differ by a statistical discrepancy, the committee considers real GDP and real gross domestic income (GDI) on an equal footing. It also places considerable weight on total payroll employment as measured by the Bureau of Labor Statistics (BLS).
-
The Peak of the Presidential Cycle
Posted by Eddy Elfenbein on July 19th, 2021 at 11:16 amWe’re coming up on the traditional peak in the four-year presidential cycle.
I took the entire history of the Dow Jones back to 1896 and crunched how it performs in four-year segments.
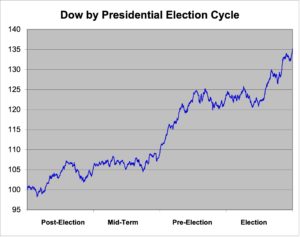
On August 4 of the post-election year, the Dow has historically peaked. This mini-bear market lasts until September 30 of the mid-term year.
Over that time, the market loses about 2.58%. That may not seem like a lot—and it’s not—but for a 14-month segment in a 125-year data series, it stands out.
For the other 34 months, the Dow has had an average gain of 38.73%. There’s another slow period from the middle of the pre-election year to the middle of the election year.
I don’t put faith in these types of stats. I think they’re interesting in a general sense. I would never make a market decision based on this.
Still, it’s interesting that incumbent presidents probably have had an effect on the stock markets. They work to make the economy peak by election day. The rally lasts for a few months before it stalls out. The market eventually bottoms around the mid-term elections.
-
Dow -700 on Covid Fears
Posted by Eddy Elfenbein on July 19th, 2021 at 10:26 amCovid is scaring the stock market once again. The Dow is currently down over 700 points. At its low, the S&P 500 was down 1.84%. This could be the worst day for market in two months. Some of the airlines are down over 5%.
Also this morning, we learned that homebuilder confidence is still high, but it’s down a bit.
A monthly sentiment index from the National Association of Home Builders dropped 1 point to 80 in July. The index stood at 72 in July 2020. Anything above 50 is considered positive. The index hit a record high of 90 in November of last year.
“Builders continue to grapple with elevated building material prices and supply shortages, particularly the price of oriented strand board, which has skyrocketed more than 500% above its January 2020 level,” said NAHB Chairman Chuck Fowke, a homebuilder from Tampa, Florida.
Robinhood is looking to sell 55 million shares between $38 and $42 per share. The ticker symbol is HOOD. It will probably go public towards the end of next week.
Here’s a look at the growing gap between High Beta and Low Vol stocks.
- Load More
Does anyone have a suit of armor, jet skis and a blowtorch I can borrow/rent? There's an experiment I'm working on.
This is pretty amazing. US elections combined since 1924:
GOP: 1,058,301,749
DEM: 1,057,846,951
Oth: 88,548,252Unemployment spikes in Washington, DC
-
-
Archives
- April 2025
- March 2025
- February 2025
- January 2025
- December 2024
- November 2024
- October 2024
- September 2024
- August 2024
- July 2024
- June 2024
- May 2024
- April 2024
- March 2024
- February 2024
- January 2024
- December 2023
- November 2023
- October 2023
- September 2023
- August 2023
- July 2023
- June 2023
- May 2023
- April 2023
- March 2023
- February 2023
- January 2023
- December 2022
- November 2022
- October 2022
- September 2022
- August 2022
- July 2022
- June 2022
- May 2022
- April 2022
- March 2022
- February 2022
- January 2022
- December 2021
- November 2021
- October 2021
- September 2021
- August 2021
- July 2021
- June 2021
- May 2021
- April 2021
- March 2021
- February 2021
- January 2021
- December 2020
- November 2020
- October 2020
- September 2020
- August 2020
- July 2020
- June 2020
- May 2020
- April 2020
- March 2020
- February 2020
- January 2020
- December 2019
- November 2019
- October 2019
- September 2019
- August 2019
- July 2019
- June 2019
- May 2019
- April 2019
- March 2019
- February 2019
- January 2019
- December 2018
- November 2018
- October 2018
- September 2018
- August 2018
- July 2018
- June 2018
- May 2018
- April 2018
- March 2018
- February 2018
- January 2018
- December 2017
- November 2017
- October 2017
- September 2017
- August 2017
- July 2017
- June 2017
- May 2017
- April 2017
- March 2017
- February 2017
- January 2017
- December 2016
- November 2016
- October 2016
- September 2016
- August 2016
- July 2016
- June 2016
- May 2016
- April 2016
- March 2016
- February 2016
- January 2016
- December 2015
- November 2015
- October 2015
- September 2015
- August 2015
- July 2015
- June 2015
- May 2015
- April 2015
- March 2015
- February 2015
- January 2015
- December 2014
- November 2014
- October 2014
- September 2014
- August 2014
- July 2014
- June 2014
- May 2014
- April 2014
- March 2014
- February 2014
- January 2014
- December 2013
- November 2013
- October 2013
- September 2013
- August 2013
- July 2013
- June 2013
- May 2013
- April 2013
- March 2013
- February 2013
- January 2013
- December 2012
- November 2012
- October 2012
- September 2012
- August 2012
- July 2012
- June 2012
- May 2012
- April 2012
- March 2012
- February 2012
- January 2012
- December 2011
- November 2011
- October 2011
- September 2011
- August 2011
- July 2011
- June 2011
- May 2011
- April 2011
- March 2011
- February 2011
- January 2011
- December 2010
- November 2010
- October 2010
- September 2010
- August 2010
- July 2010
- June 2010
- May 2010
- April 2010
- March 2010
- February 2010
- January 2010
- December 2009
- November 2009
- October 2009
- September 2009
- August 2009
- July 2009
- June 2009
- May 2009
- April 2009
- March 2009
- February 2009
- January 2009
- December 2008
- November 2008
- October 2008
- September 2008
- August 2008
- July 2008
- June 2008
- May 2008
- April 2008
- March 2008
- February 2008
- January 2008
- December 2007
- November 2007
- October 2007
- September 2007
- August 2007
- July 2007
- June 2007
- May 2007
- April 2007
- March 2007
- February 2007
- January 2007
- December 2006
- November 2006
- October 2006
- September 2006
- August 2006
- July 2006
- June 2006
- May 2006
- April 2006
- March 2006
- February 2006
- January 2006
- December 2005
- November 2005
- October 2005
- September 2005
- August 2005
- July 2005
 Eddy Elfenbein is a Washington, DC-based speaker, portfolio manager and editor of the blog Crossing Wall Street. His