-
The Formula to Spot a Bubble
Posted by Eddy Elfenbein on February 17th, 2021 at 3:23 pmMark Hulbert has an interesting column at MarketWatch. It’s about a trio of academics who have devised a bubble-spotting formula.
Applying the formula the researchers derive, I calculate there is an 80% chance that the Technology Hardware, Storage & Peripherals index will be 40% lower than today at some point in the next two years. Among some of the better-known firms in this industry are Apple (ticker: AAPL), Seagate Technology (STX), and Western Digital (WDC).
Though no other industries satisfy the researchers’ definition of a bubble, two others come close. They are also in the technology arena: Semiconductors and Semiconductor Equipment, and Software.
Why focus on an industry that may be in a bubble, rather than the market as a whole? Prof. Greenwood told Barron’s that he and his fellow researchers learned from their study of the history of bubbles that they “rarely are marketwide” events. Far more common, he said, is for a bubble to manifest in certain pockets of the market even as other sectors remain undervalued.
So what do they look for?
The researchers define a bubble to be any industry whose two-year return is at least 100 percentage points greater than the overall market’s. This is a high standard indeed—among all industries for which they had performance data between 1926 and 2016, just 40 satisfied the definition at any point over this 90-year period.
Not all bubbles burst, of course, and those that do don’t always burst right away. The researchers imposed a strict precondition here as well: Once an industry satisfied their definition of a bubble, they considered it to have burst if, within the subsequent two years, it lost at least 40% of its value. Of the 40 industries that satisfied the researchers’ definition of a bubble, 21—or 53%—burst.
-
Morning News: February 17, 2021
Posted by Eddy Elfenbein on February 17th, 2021 at 7:02 amInflation Isn’t Lurking Around the Corner. This Isn’t the 1970s.
Special Report: Amazon Documents Reveal Company’s Secret Strategy to Dodge India’s Regulators
U.S. Oil Output Slumps by Record One-Third as Permian Freezes
In Texas’s Black-Swan Blackout, Everything Went Wrong at Once
Winter Storm Disrupts Wide Swath of American Business
The Auto Industry Bets Its Future on Batteries
Bitcoin Scales $51,000 for the First Time Amid Crypto Fever
Big Tech’s Next Big Problem Could Come From People Like ‘Mr. Sweepy’
Epic Games Takes Apple Fight to EU Antitrust Regulators
Citibank Can’t Get Back $500 Million It Wired By Mistake, Judge Rules
The Lockdown Showed How the Economy Exploits Women. She Already Knew.
Nick Maggiulli: Respect the Base Rate
Ben Carlson: Why Valuations Probably Won’t Matter For A While
Michael Batnick: Animal Spirits: Bidding Wars
Be sure to follow me on Twitter.
-
The Twitter Tax Code
Posted by Eddy Elfenbein on February 16th, 2021 at 12:42 pmOver the weekend, I ran a series of ten polls on Twitter asking people how much should a theoretical family of four pay in federal income taxes. For the different polls, I used gradually rising incomes; $30,000, $40,000, $50,000, $60,000, $100,000, $200,000, $500,000, $1,000,000 and $10,000,000. For clarity, I only meant federal income taxes and I was asking for the effective rate.
My goal was to see if I could calculate tax brackets that would fit the data points from our 10 polls.
Twitter’s polls only allow for four responses, so I had to use some crude interpolation to estimate the median response.
Here are the results:
$50,000: 0.92%
$60,000: 0.24%
$75,000: 4.73%
$100,000: 9.70%
$200,000: 17.17%
$500,000: 25.39%
$1,000,000: 32.54%
$10,000,000: 36.67%Here’s what a scatterplot looks like. Income is the X-axis and the tax bill is the Y-axis. Both axes have log scales.
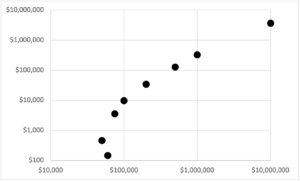
Among the 10 polls, I got more than 20,000 votes. Let me get a few things out of the way. Obviously, this is hardly a scientific poll. I was just doing it for fun.
Also, I adjusted each of the response brackets to get a more realistic result. For example, the lower-income polls had answer ranges that were $3,000 wide. The higher polls had $20,000 ranges. This probably is a big no-no for academics, but I had to make do with what I had.
Some of the results don’t even make sense. For example, there’s a higher tax on $50,000 than on $60,000. Also, some of the answers don’t line up well. For example, our polls show a higher tax on income from $500,000 to $1,000,000 than on income from $1,000,000 to $10,000,000.
Nevertheless, I made a few rough adjustments, brought out some math and calculated our Twitter tax code.
First off, the polls showed a majority for no tax on incomes of $30,000 or $40,000. To make things easy, I also left $50,000 and $60,000 tax free since our polls showed a very small rate for these levels. Also, as I said before, our polls gave these levels a regressive response.
Here’s how it goes:
The first $60,610.78 is tax free.
Income between $60,610.78 and $375,534.57 is taxed at 24.63%.
Income over $375,534.57 is taxed at 39.69%.
That lines up with our poll results very well. One small exception is that under these brackets, the $10 million family is overtaxed by 2.3% (meaning higher than what our polls wanted.)
A number of commenters advocated for a flat tax. That’s an interesting idea but the responses from our polls don’t line up well with any flat tax scenario.
Here’s the log chart again, except for the two lowest data points. To find the best fitting flat tax equation, all we need to do is add a linear trend line.
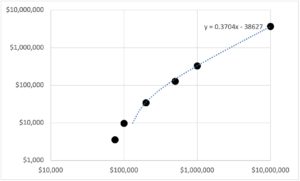
The slope of the line is the flat tax rate. In this case, it’s 37.04%. The deduction is the y-intercept divided by the slope. In this case, it’s $104,284.
Interesting, but that strays pretty far from our tax responses. Still, two brackets does the trick quite well.
-
Zoetis Earns 91 Cents per Share
Posted by Eddy Elfenbein on February 16th, 2021 at 7:49 amThis morning, Zoetis (ZTS) reported Q4 earnings of 91 cents per share. That topped Wall Street’s estimate of 87 cents per share. Quarterly net revenue rose by 8% to 1.8 billion. For the full year, Zoetis made $3.85 per share.
“In 2020, Zoetis delivered another year of strong growth and market leadership thanks to our diverse and durable portfolio, our commitment to continuous innovation and the essential nature of our business,” said Kristin Peck, Chief Executive Officer of Zoetis. “We grew revenue 9% operationally, which is once again above market growth in a competitive, global sector. We also grew our adjusted net income faster than revenue, at 10% operationally.”
“Looking forward, we believe this momentum sets us up for a strong 2021, even amidst ongoing COVID-19 uncertainty. We expect to continue growing revenue faster than the market in 2021 driven by continued strength in petcare; ongoing expansion in markets outside the U.S., most notably China; and acceleration of our diagnostics portfolio penetration. As a result, we are guiding to full-year operational growth of 9% to 11% in revenue,” said Peck.
For 2021, Zoetis sees revenue between $7.40 billion and $7.55 billion, and EPS between $4.36 and $4.46. Wall Street had been expecting earnings of $4.26 per share on revenues of $7.11 billion. Shares of ZTS are up about 1.5% in premarket trading.
-
Morning News: February 16, 2021
Posted by Eddy Elfenbein on February 16th, 2021 at 7:03 amGlobal Bonds Are Suffering the Worst Start to a Year Since 2013
‘Super Mario’ Saved the Euro. Fixing Italy’s Economy May Be A Bigger Challenge
Biden and the Fed Leave 1970s Inflation Fears Behind
Stimulus Hopes Lift Futures to All-Time Highs
Natural Gas Skyrockets Again to $500 as Blackouts Spread in U.S.
How Extreme Cold Turned Into a U.S. Energy Crisis
Bill Gates Has a Master Plan for Battling Climate Change
Jaguar Vehicles To Go Fully Electric in 2025
Elon Musk Asks ‘Major Dogecoin Holders’ To Sell Most Of Their Coins
Is Tesla’s Bitcoin Investment a Good Move?
TikTok’s U.S. Ad Business Roars Back As Trump’s Threats Recede
Clubhouse, a Tiny Audio Chat App, Breaks Through
Howard Lindzon: Momentum Monday – Everyone and Everything Is High
Ben Carlson: Why Is College So Expensive?
Be sure to follow me on Twitter.
-
Morning News: February 15, 2021
Posted by Eddy Elfenbein on February 15th, 2021 at 7:05 amJapan’s Nikkei 225 Tops 30,000 For First Time Since 1990
As Lebanon’s Banks Struggle to Raise Capital, A Deadline Looms
Global Shares Hit Fresh Peak, Oil Up On Middle East Tensions
Bill Gates Shows How Hard It Can Be to Divest From Fossil Fuel
W.T.O. Set to Gain New Chief, But Deep Issues Remain
Bitcoin Rally Falters Just Short of $50,000 As Investors Take Profit
Big Tech’s Unlikely Next Battleground: North Dakota
Tesla to Start Making Cars in India, Targeting Vast Market
Brevan Howard Has a Plan to Outlast Its Billionaire Founder
Wine Tariffs Are Crushing US Importers
Nick Maggiulli: The 10 Biggest Money Mistakes
Jeff Miller: Weighing the Week Ahead: A Letter from Mr. Market!
Michael Batnick: Animal Spirits: The Madness of Crowds & How to Square this Circle
Ben Carlson: The Biggest Difference Between Now & the Dot-Com Bubble & A Short History of U.S. Stock Market Corrections & Bear Markets
Be sure to follow me on Twitter.
-
Moody’s Earns $1.91 per Share
Posted by Eddy Elfenbein on February 12th, 2021 at 12:01 pmThis morning, Moody’s (MCO) reported Q4 earnings of $1.91 per share. That was six cents below estimates. The good news is that revenues beat estimates, and Moody’s provided an upbeat forecast for this year. For Q4, revenues rose 4.6% to $1.29 billion. Wall Street had been looking for $1.22 billion.
“MIS had another strong quarter with a favorable issuance mix from leveraged loans and infrequent bank issuers. Our MA team delivered growth by staying close to the customer, driving subscription sales and high retention,” said Robert Fauber, President and Chief Executive Officer of Moody’s. “As managing risk becomes more complex, the demand for our insights and solutions has never been greater. In 2021, we will help our customers navigate the changing environment by continuing to enhance our products, bringing new capabilities to the market and building on the strengths of our core businesses. We project 2021 revenue growth in the mid-single-digit percent range with strong growth in Moody’s Analytics offsetting expectations for a modest decline in global debt issuance.”
Moody’s sees 2021 earnings ranging between $10.30 and $10.70 per share. Wall Street had been expecting $10.34 per share.
Moody’s also raised its quarterly dividend by 11% to 62 cents per share.
-
CWS Market Review – February 12, 2021
Posted by Eddy Elfenbein on February 12th, 2021 at 7:08 am”Most successful investors, in fact, do nothing most of the time.” – Jim Rogers
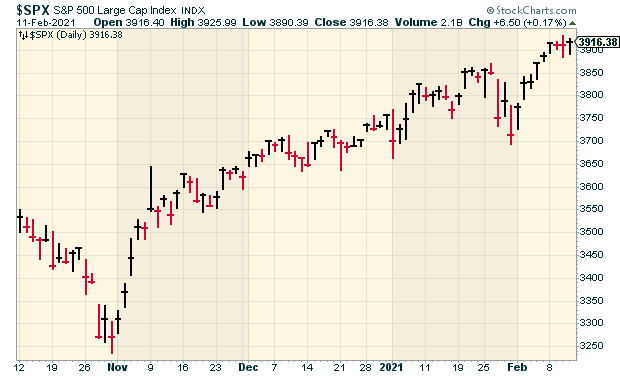
The stock market closed Thursday at another all-time high, but it was close. Very close. The S&P 500 beat out Monday’s close by just 0.02%. Annualized, that three-day move comes out to about 1.7%. Still, it’s a new high, and we’ll take it.
The market has been on quite a run since late October.
We’re still in the midst of earnings season. We finally broke our streak of earnings “beats” when Cerner merely met Wall Street’s expectations. Fiserv beat earnings and delivered its 35th year in a row of double-digit earnings growth. But the big star this week was Disney. The Mouse House was expected to report a loss for Q4. Instead, Disney made a nice profit.
Disney is a powerhouse. The company’s Disney+ streaming service now has 95 million subscribers, and it’s rolled out to about two dozen countries, whereas Netflix is available in 190 countries. There’s so much room to grow. I’ll have all the details in a bit.
I’ll also preview two more Buy List earnings reports for next week. But first, let’s look at an important fact—why this has been a “low quality” rally.
The Rally in Crap
One of the interesting features of the current rally, and one of the least commented-upon, is that it’s been a “low-quality” rally. Let me explain what I mean by that.
Market analysts have many ways they can slice and dice the market. I often talk about the relative performance of value stocks or cyclical stocks. Those are well-known ones, but quality is another one, and it’s often overlooked.
By quality, we refer to a company’s overall financial strength. The problem with the quality factor is that no one can agree on the precise definition. Still, even without the exact definition, we have an idea where quality lies.
(As a side note, I’m a little skeptical of how some of these factors are created. I think the process can be overly mechanistic. For example, I’ve discussed in previous issues how the value factor has slowly become a finance and energy factor. I’m not even sure a small-cap factor truly exists.)
Here’s an example of the quality factor. This is a chart of Fidelity’s Quality Factor ETF (FQAL).
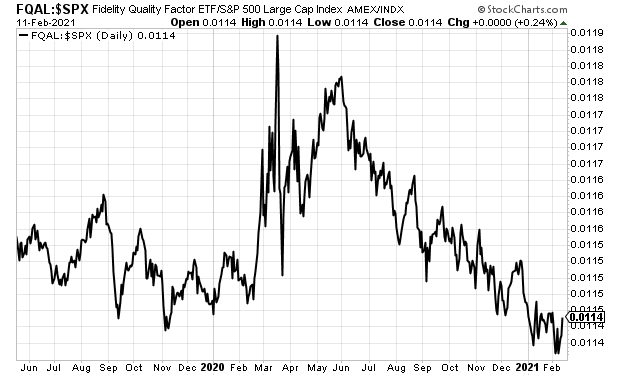
More precisely, this is the ETF’s relative strength, meaning It’s FQAL divided by the S&P 500. In simple terms, if the line is rising, then high-quality stocks are beating the market. It it’s falling, then quality is lagging.
The key part of this graph is February to May of last year. That’s when the market started to crash as the coronavirus appeared. Yet FQAL’s relative strength soared. It’s easy to understand why. As everyone was panicking, quality held steady, in a relative sense. When investors get scared, they seek out quality.
Notice also how the line became very jagged in March. That’s revealing, because it indicates that the quality factor was “in play.” You’ll notice how a major stock either soars or plunges each day. That’s because the thesis becomes in play, and the market wrestles with the next step. That’s what happened after quality soared last year.
By late-May, the quality rally started to fizzle. Since then, quality stocks have lagged consistently. As the rally has gone on longer, it’s become more dependent on lower-quality stocks. A low-quality rally isn’t necessarily a bad thing. Investment dollars need to flow to marginal businesses. The problem is that investors have become very tolerant of stocks without much going for them.
I’m not predicting a market top, but we have to be aware of what’s truly driving the market higher. Investors should not be lulled in by the impressive performance of low-quality stocks. When the cycle changes, and it will, many low-qual stocks will not be pleased.
For now, investors should remain patient. Quality isn’t exciting, but it does well in the long run. Now let’s take a look at some recent earnings news.
Three Earnings Reports this Week
Here’s the updated Earnings Calendar:
Stock Ticker Date Estimate Result Silgan SLGN 26-Jan $0.53 $0.60 Abbott Labs ABT 27-Jan $1.35 $1.45 Stryker SYK 27-Jan $2.55 $2.81 Danaher DHR 28-Jan $1.87 $2.08 Sherwin-Williams SHW 28-Jan $4.85 $5.09 Church & Dwight CHD 29-Jan $0.52 $0.53 Thermo Fisher TMO 1-Feb $6.56 $7.09 Broadridge Financial Sol BR 2-Feb $0.70 $0.73 AFLAC AFL 3-Feb $1.05 $1.07 Check Point Software CHKP 3-Feb $2.11 $2.17 Hershey HSY 4-Feb $1.43 $1.49 Intercontinental Exchange ICE 4-Feb $1.08 $1.13 Fiserv FISV 9-Feb $1.29 $1.30 Cerner CERN 10-Feb $0.78 $0.78 Disney DIS 11-Feb -$0.42 $0.32 Moody’s MCO 12-Feb $1.96 Zoetis ZTS 16-Feb $0.86 Stepan SCL 18-Feb $1.08 Trex TREX 22-Feb $0.36 Ansys ANSS 24-Feb $2.54 Middleby MIDD 24-Feb $1.40 Miller Industries MLR TBA n/a After the closing bell on Tuesday, Fiserv (FISV) reported Q4 earnings of $1.30 per share. That topped expectations by one penny per share. This was the company’s 35th year in a row of double-digit earnings growth. For 2020, Fiserv earned $4.42 per share compared with $3.96 per share for 2019, so earnings growth came in at 11.6%. Previously, the company said it expected 2020 earnings growth of 11%.
For 2020, operating cash flow rose by 48% to $4.15 billion. Free cash flow increased 7% to $1.05 billion in the quarter, and 11% to $3.65 billion for the full year.
For 2021, Fiserv expects revenue growth of 8% to 12%. For earnings, Fiserv sees earnings of $5.30 to $5.50 per share. That’s growth of 20% to 24%. Wall Street had been expecting $5.39 per share. I think it’s very likely we’ll see year #36 in a row.
More good news. The board approved a new 60-million-share buyback authorization. During Q4, Fiserv bought back 1.8 million shares for $200 million. For the whole year, Fiserv bought back 16.1 million shares for $1.64 billion. The shares pulled back some after the report. Fiserv is a buy up to $120 per share.
On Wednesday, Cerner (CERN) reported Q4 earnings of 78 cents per share. That matched Wall Street’s estimate. Previously, the company told us to expect quarterly earnings between 76 and 80 cents per share. Cerner is usually pretty accurate with its guidance.
Revenues came in at $1.395 billion. The company had been expecting between $1.365 billion and $1.415 billion. COVID hit Cerner pretty hard, but the company has managed itself well. For the year, Cerner made $2.84 per share. That’s up from $2.68 per share in 2019.
“Cerner’s fourth-quarter results reflect a very solid finish to the year,” said Brent Shafer, Chairman and CEO of Cerner. “I’m pleased with Cerner’s execution and commitment to supporting our clients in a challenging environment. Despite these challenges, Cerner delivered on financial goals, continued to make operational improvements, and further refined our growth strategies. As a result of our progress in 2020, we enter 2021 well-positioned to deliver increased value to our clients while also driving profitable growth for shareholders.”
Now let’s look at guidance.
For Q1, Cerner expects earnings of 72 to 76 cents per share on revenue of $1.37 billion to $1.42 billion. Wall Street had been expecting 76 cents per share.
For the whole year, Cerner sees earnings of $3.10 to $3.20 per share on revenue of $5.75 billion to $5.95 billion. Wall Street had been expecting $3.22 per share. Wall Street wasn’t thrilled with this guidance; the stock took a dip, but nothing major.
Don’t forget how a strong a company this is. In December, Cerner hiked its dividend by 22% to 22 cents per share. I rate Cerner a buy up to $82 per share.
After the bell on Thursday, Disney (DIS) reported very impressive numbers. Wall Street had been expecting a loss of 42 cents per share. Instead, the entertainment giant reported a profit of 32 cents per share.
The big number is 94.9 million. That’s the number of Disney+ subscribers. ESPN+ is up to 12.1 million subscribers. Add in Hulu and ESPN, and Disney is up to 146 million direct-to-consumer subscribers. Disney has said that it expects its DTC business to be profitable by 2024. At this rate, I think they can be profitable by 2023, maybe sooner.
Disney+ is available in about two dozen countries, while Netflix is available in 190 countries. The next test for Disney, Netflix and others is to see how well a new movie can drive subscribers.
Quarterly revenues hit $16.26 billion, which topped estimates of $15.93 billion. The company said that the impact from COVID was $2.6 billion in lost operating income. Disney had no new theatrical releases during October, November and December.
Disney recently reorganized itself due to its shift towards streaming. This was the first earnings report with the new divisions. The Parks Experiences and Products unit saw its revenues drop by 53% last quarter. Believe it or not, that was actually stronger than expected. Revenues at the Direct-to-Consumer unit rose 73%.
This week, I’m lifting my Buy Below price on Disney to $200 per share.
Moody’s (MCO) will report later today. In October, Moody’s raised its full-year guidance range from $8.80 to $9.20 per share to $9.95 to $10.15 per share. For the first three quarters, Moody’s has made $8.24 per share, so that implies Q4 earnings of $1.71 to $1.91 per share.
Earnings Preview for Zoetis and Stepan
We’re heading into the backend of earnings season. There are two more Buy List earnings reports next week.
Zoetis (ZTS) is one of our new stocks this year. The company makes and sells veterinary products. Zoetis helps keep your pets healthy and active. It’s not just pets: they also make medicines for livestock.
I like this company a lot. For the last earnings report, Wall Street had been expecting earnings of 92 cents per share. Instead, Zoetis made $1.10 per share. In December, the company hiked its dividend by 25%.
The earnings report is due out on Tuesday morning. In October, Zoetis said to expect full-year earnings between $3.76 and $3.81 per share. Since Zoetis has already made $2.94 per share through the first three quarters, that implies Q4 earnings of 82 to 87 cents per share.
On Thursday, it’s Stepan’s (SCL) turn. Three months ago, the chemical company delivered a solid earnings report. The company also raised its dividend, making it the 53rd annual dividend increase. The dividend increased from 27.5 cents to 30.5 cents per share
Stepan has three operating groups. The Surfactants division has been doing well, but Polymers and Specialty Products have been weak. Wall Street expects earnings of $1.08 per share, but only three analysts follow the stock.
The week after next, Trex (TREX), Ansys (ANSS) and Middleby (MIDD) are due to report. Not only that, but the January cycle reports will start soon. HEICO (HEI) is scheduled to report on February 23. I’ll have more details next week.
That’s all for now. The stock market will be closed on Monday in honor of George Washington’s birthday. (The NYSE celebrates Washington’s birthday, not President’s Day.) In addition to more earnings news, the retail-sales and industrial-production reports are due out on Wednesday. Also on Wednesday, the Federal Reserve will release the minutes from its last meeting. Be sure to keep checking the blog for daily updates. I’ll have more market analysis for you in the next issue of CWS Market Review!
– Eddy
Morning News: February 12, 2021
Posted by Eddy Elfenbein on February 12th, 2021 at 7:03 amThe Long Hack: How China Exploited a U.S. Tech Supplier
Two Arrests, Two Outcomes Tell a Tale of Xi Jinping’s China
UK Economy Slumps by Record 10% in 2020 After COVID Hit
Australia to Introduce Landmark Google, Facebook Legislation to Parliament Next Week
Stock Trading Frenzy Has U.S. Volumes Near Peak Panic Levels
Maryland Nears Country’s First Tax on Big Tech’s Ad Revenue
Is Elon Musk the New Stock Market Oracle?
Different Stonks – Why Gang Weed Is Not the Next GameStop
Bumble Starts Trading After Its $2.15 Billion IPO. Should You Buy?
Bumble CEO Whitney Wolfe Herd Becomes the Youngest Woman To Take A Company Public
After A Rough Start, Sweethearts Are Back With A Song
Joshua Brown: The Best Defense Is A Good Offense…Lately
Michael Batnick: Markets Are Always Changing
Ben Carlson: The Defining Trait of All Bubbles: The Willful Suspension of Disbelief
Be sure to follow me on Twitter.
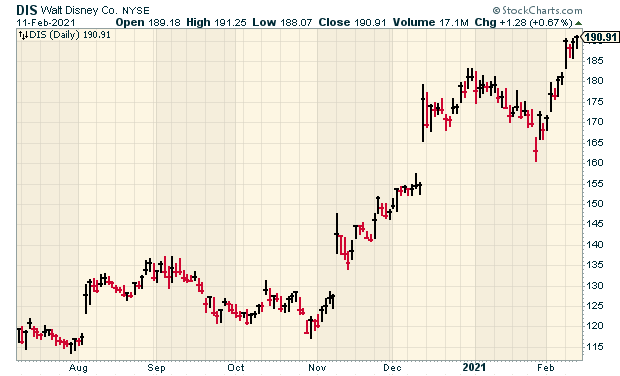
Disney’s Earnings Are Due After the Close
Posted by Eddy Elfenbein on February 11th, 2021 at 11:31 amToday is earnings day for Disney (DIS). The entertainment giant usually gets a lot of attention. The report is due out after today’s close. The current estimate is for Disney to lose 42 cents per share. Analysts will pay particular attention to Disney’s latest streaming numbers.
We broke our string of Buy List stocks beating expectations. Cerner merely met expectations. All the rest have beaten.
This morning’s jobless claims report came in at 793,000. That’s down from 812,000 from last week but it was above Wall Street’s estimate of 760,000.
In last week’s jobs report, the unemployment rate fell to 6.3%. That surprised a lot of people. The reason for the fall is that fewer people are looking for jobs.
Yesterday, Fed Chair Jerome Powell gave a speech and said, “Correcting this misclassification and counting those who have left the labor force since last February as unemployed would boost the unemployment rate to close to 10 percent in January.”
I would estimate that the U.S. economy is about 10 million jobs from full employment.
- Load More
Does anyone have a suit of armor, jet skis and a blowtorch I can borrow/rent? There's an experiment I'm working on.
This is pretty amazing. US elections combined since 1924:
GOP: 1,058,301,749
DEM: 1,057,846,951
Oth: 88,548,252Unemployment spikes in Washington, DC
-
-
Archives
- April 2025
- March 2025
- February 2025
- January 2025
- December 2024
- November 2024
- October 2024
- September 2024
- August 2024
- July 2024
- June 2024
- May 2024
- April 2024
- March 2024
- February 2024
- January 2024
- December 2023
- November 2023
- October 2023
- September 2023
- August 2023
- July 2023
- June 2023
- May 2023
- April 2023
- March 2023
- February 2023
- January 2023
- December 2022
- November 2022
- October 2022
- September 2022
- August 2022
- July 2022
- June 2022
- May 2022
- April 2022
- March 2022
- February 2022
- January 2022
- December 2021
- November 2021
- October 2021
- September 2021
- August 2021
- July 2021
- June 2021
- May 2021
- April 2021
- March 2021
- February 2021
- January 2021
- December 2020
- November 2020
- October 2020
- September 2020
- August 2020
- July 2020
- June 2020
- May 2020
- April 2020
- March 2020
- February 2020
- January 2020
- December 2019
- November 2019
- October 2019
- September 2019
- August 2019
- July 2019
- June 2019
- May 2019
- April 2019
- March 2019
- February 2019
- January 2019
- December 2018
- November 2018
- October 2018
- September 2018
- August 2018
- July 2018
- June 2018
- May 2018
- April 2018
- March 2018
- February 2018
- January 2018
- December 2017
- November 2017
- October 2017
- September 2017
- August 2017
- July 2017
- June 2017
- May 2017
- April 2017
- March 2017
- February 2017
- January 2017
- December 2016
- November 2016
- October 2016
- September 2016
- August 2016
- July 2016
- June 2016
- May 2016
- April 2016
- March 2016
- February 2016
- January 2016
- December 2015
- November 2015
- October 2015
- September 2015
- August 2015
- July 2015
- June 2015
- May 2015
- April 2015
- March 2015
- February 2015
- January 2015
- December 2014
- November 2014
- October 2014
- September 2014
- August 2014
- July 2014
- June 2014
- May 2014
- April 2014
- March 2014
- February 2014
- January 2014
- December 2013
- November 2013
- October 2013
- September 2013
- August 2013
- July 2013
- June 2013
- May 2013
- April 2013
- March 2013
- February 2013
- January 2013
- December 2012
- November 2012
- October 2012
- September 2012
- August 2012
- July 2012
- June 2012
- May 2012
- April 2012
- March 2012
- February 2012
- January 2012
- December 2011
- November 2011
- October 2011
- September 2011
- August 2011
- July 2011
- June 2011
- May 2011
- April 2011
- March 2011
- February 2011
- January 2011
- December 2010
- November 2010
- October 2010
- September 2010
- August 2010
- July 2010
- June 2010
- May 2010
- April 2010
- March 2010
- February 2010
- January 2010
- December 2009
- November 2009
- October 2009
- September 2009
- August 2009
- July 2009
- June 2009
- May 2009
- April 2009
- March 2009
- February 2009
- January 2009
- December 2008
- November 2008
- October 2008
- September 2008
- August 2008
- July 2008
- June 2008
- May 2008
- April 2008
- March 2008
- February 2008
- January 2008
- December 2007
- November 2007
- October 2007
- September 2007
- August 2007
- July 2007
- June 2007
- May 2007
- April 2007
- March 2007
- February 2007
- January 2007
- December 2006
- November 2006
- October 2006
- September 2006
- August 2006
- July 2006
- June 2006
- May 2006
- April 2006
- March 2006
- February 2006
- January 2006
- December 2005
- November 2005
- October 2005
- September 2005
- August 2005
- July 2005
 Eddy Elfenbein is a Washington, DC-based speaker, portfolio manager and editor of the blog Crossing Wall Street. His